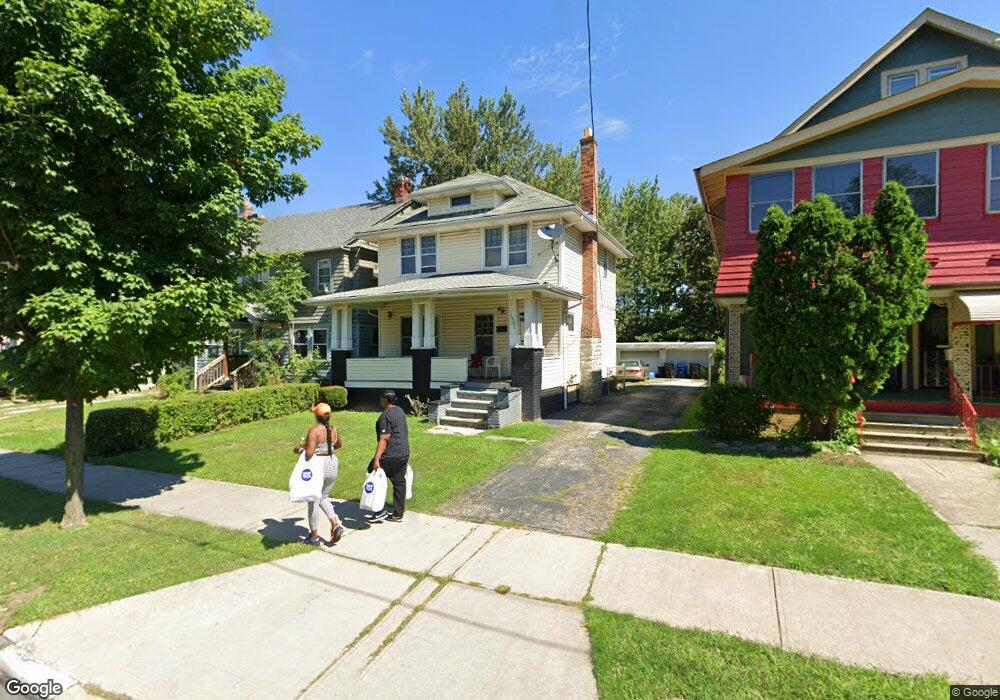
1737 Cliffview Rd Cleveland, OH 44112
Euclid-Green NeighborhoodEstimated Value: $60,000 - $78,194
3
Beds
1
Bath
1,184
Sq Ft
$60/Sq Ft
Est. Value
About This Home
This home is located at 1737 Cliffview Rd, Cleveland, OH 44112 and is currently estimated at $70,799, approximately $59 per square foot. 1737 Cliffview Rd is a home located in Cuyahoga County with nearby schools including Bolton, Anton Grdina School, and Andrew J. Rickoff School.
Ownership History
Date
Name
Owned For
Owner Type
Purchase Details
Closed on
Aug 19, 2008
Sold by
Equity One Inc Of Camden
Bought by
Davis Linell L
Current Estimated Value
Purchase Details
Closed on
Feb 16, 2007
Sold by
Wilson Irene D and Wilson Albert B
Bought by
Equity One Inc
Purchase Details
Closed on
Sep 4, 1997
Sold by
Britta Aldo
Bought by
Wilson Albert S and Wilson Irene D
Home Financials for this Owner
Home Financials are based on the most recent Mortgage that was taken out on this home.
Original Mortgage
$30,000
Interest Rate
7.54%
Mortgage Type
New Conventional
Purchase Details
Closed on
Jun 21, 1984
Sold by
Evelyn E Corley
Bought by
Wilson Albert B and Wilson Irene D
Purchase Details
Closed on
Sep 17, 1981
Sold by
Corley George H
Bought by
Evelyn E Corley
Purchase Details
Closed on
Jan 11, 1979
Sold by
Hicks Wesley L and Hicks Sharon L
Bought by
Corley George H
Purchase Details
Closed on
Jan 1, 1975
Bought by
Hicks Wesley L and Hicks Sharon L
Create a Home Valuation Report for This Property
The Home Valuation Report is an in-depth analysis detailing your home's value as well as a comparison with similar homes in the area
Home Values in the Area
Average Home Value in this Area
Purchase History
| Date | Buyer | Sale Price | Title Company |
|---|---|---|---|
| Davis Linell L | $4,700 | Landam-Lawyers East | |
| Equity One Inc | $20,000 | Attorney | |
| Wilson Albert S | $35,000 | -- | |
| Wilson Albert B | $36,000 | -- | |
| Evelyn E Corley | -- | -- | |
| Corley George H | $18,000 | -- | |
| Hicks Wesley L | -- | -- |
Source: Public Records
Mortgage History
| Date | Status | Borrower | Loan Amount |
|---|---|---|---|
| Previous Owner | Wilson Albert S | $30,000 |
Source: Public Records
Tax History Compared to Growth
Tax History
| Year | Tax Paid | Tax Assessment Tax Assessment Total Assessment is a certain percentage of the fair market value that is determined by local assessors to be the total taxable value of land and additions on the property. | Land | Improvement |
|---|---|---|---|---|
| 2024 | $1,393 | $21,245 | $4,655 | $16,590 |
| 2023 | $964 | $12,710 | $1,860 | $10,850 |
| 2022 | $959 | $12,705 | $1,855 | $10,850 |
| 2021 | $949 | $12,710 | $1,860 | $10,850 |
| 2020 | $913 | $10,570 | $1,540 | $9,030 |
| 2019 | $844 | $30,200 | $4,400 | $25,800 |
| 2018 | $841 | $10,570 | $1,540 | $9,030 |
| 2017 | $601 | $7,290 | $810 | $6,480 |
| 2016 | $597 | $7,290 | $810 | $6,480 |
| 2015 | $3,214 | $7,290 | $810 | $6,480 |
| 2014 | $3,214 | $7,490 | $840 | $6,650 |
Source: Public Records
Map
Nearby Homes
- 1738 Cliffview Rd
- 1682 Cliffview Rd
- 1738 Burgess Rd
- 18001 Olympia Rd
- 1646 Avalon Rd
- 1651 Avalon Rd
- 1677 Hillview Rd
- 1639 Avalon Rd
- 1707 Catalpa Rd
- 1777 Catalpa Rd
- 1617 Catalpa Rd
- 1897 Torbenson Dr
- 1547 E 173rd St
- 940 London Rd
- 16519 Burnside Ave
- 19151 Genesee Rd
- 949 Rudyard Rd
- 1767 Algonac Rd Unit 2
- 897 Rudyard Rd
- 1758 Algonac Rd
- 1733 Cliffview Rd
- 1739 Cliffview Rd
- 1745 Cliffview Rd
- 1725 Cliffview Rd
- 1747 Cliffview Rd
- 1721 Cliffview Rd
- 1721 Cliffview Rd Unit Upper
- 1721 Cliffview Rd Unit Lower
- 1732 Avalon Rd
- 1728 Avalon Rd
- 1736 Avalon Rd
- 1753 Cliffview Rd
- 1724 Avalon Rd
- 1717 Cliffview Rd
- 1740 Avalon Rd
- 1734 Cliffview Rd
- 1720 Avalon Rd
- 1730 Cliffview Rd
- 1742 Cliffview Rd
- 1746 Avalon Rd