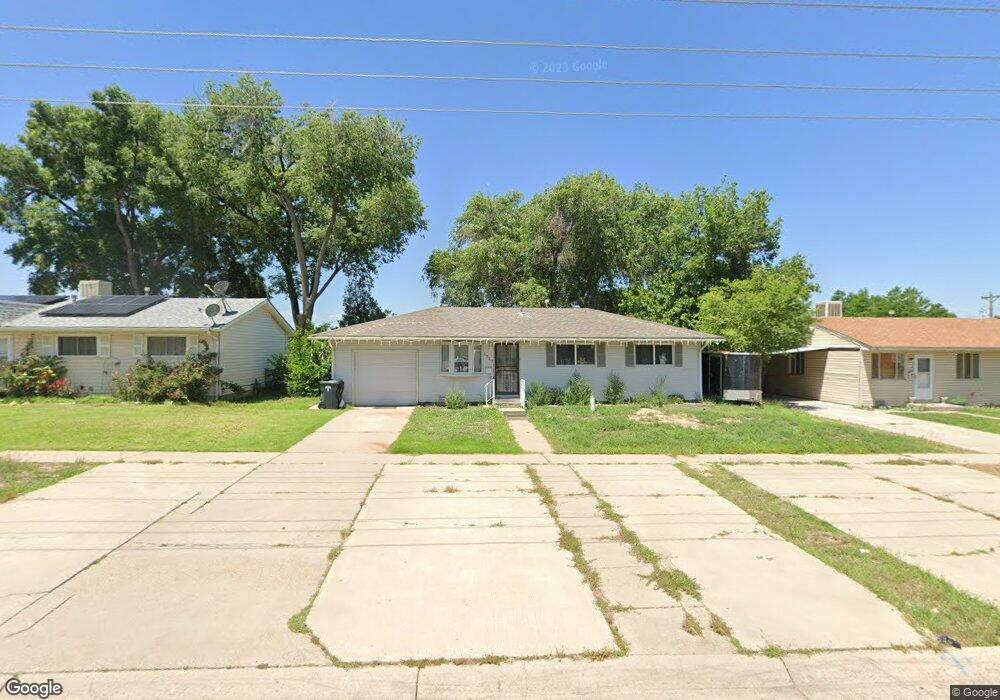
1737 Jerry Murphy Rd Pueblo, CO 81001
Belmont NeighborhoodEstimated Value: $207,000 - $221,000
3
Beds
1
Bath
925
Sq Ft
$232/Sq Ft
Est. Value
About This Home
This home is located at 1737 Jerry Murphy Rd, Pueblo, CO 81001 and is currently estimated at $214,235, approximately $231 per square foot. 1737 Jerry Murphy Rd is a home located in Pueblo County with nearby schools including Haaff Elementary School, Heaton Middle School, and East High School.
Ownership History
Date
Name
Owned For
Owner Type
Purchase Details
Closed on
Oct 19, 2019
Sold by
Smith Margaret L
Bought by
Tigner Andelecia C and Bustamante Maryrose J
Current Estimated Value
Home Financials for this Owner
Home Financials are based on the most recent Mortgage that was taken out on this home.
Original Mortgage
$50,000
Outstanding Balance
$43,892
Interest Rate
3.6%
Mortgage Type
New Conventional
Estimated Equity
$170,343
Purchase Details
Closed on
Jul 26, 2005
Sold by
Smith Gary Lee
Bought by
Smith Margaret I
Purchase Details
Closed on
May 3, 1990
Bought by
Smith Gary L + Margaret
Purchase Details
Closed on
Jul 11, 1986
Sold by
Adm Veteran Affairs
Bought by
Gallegos Filemon
Purchase Details
Closed on
Sep 11, 1978
Sold by
Nt
Bought by
Adm Veteran Affairs
Purchase Details
Closed on
May 31, 1978
Sold by
Gleason J S
Bought by
Nt
Create a Home Valuation Report for This Property
The Home Valuation Report is an in-depth analysis detailing your home's value as well as a comparison with similar homes in the area
Home Values in the Area
Average Home Value in this Area
Purchase History
| Date | Buyer | Sale Price | Title Company |
|---|---|---|---|
| Tigner Andelecia C | $52,632 | Silk Title & Escrow Llc | |
| Smith Margaret I | -- | Fahtco | |
| Smith Gary L + Margaret | $45,000 | -- | |
| -- | -- | -- | |
| Gallegos Filemon | -- | -- | |
| Adm Veteran Affairs | -- | -- | |
| Nt | $32,000 | -- |
Source: Public Records
Mortgage History
| Date | Status | Borrower | Loan Amount |
|---|---|---|---|
| Open | Tigner Andelecia C | $50,000 |
Source: Public Records
Tax History Compared to Growth
Tax History
| Year | Tax Paid | Tax Assessment Tax Assessment Total Assessment is a certain percentage of the fair market value that is determined by local assessors to be the total taxable value of land and additions on the property. | Land | Improvement |
|---|---|---|---|---|
| 2024 | $933 | $9,490 | -- | -- |
| 2023 | $944 | $13,180 | $1,340 | $11,840 |
| 2022 | $1,017 | $10,240 | $1,390 | $8,850 |
| 2021 | $1,049 | $10,540 | $1,430 | $9,110 |
| 2020 | $731 | $10,540 | $1,430 | $9,110 |
| 2019 | $732 | $7,245 | $644 | $6,601 |
| 2018 | $588 | $6,490 | $648 | $5,842 |
| 2017 | $594 | $6,490 | $648 | $5,842 |
| 2016 | $548 | $6,033 | $716 | $5,317 |
| 2015 | $273 | $6,033 | $716 | $5,317 |
| 2014 | $271 | $5,970 | $716 | $5,254 |
Source: Public Records
Map
Nearby Homes
- 1706 Comanche Rd
- 1701 Jerry Murphy Rd
- 36 Scotland Rd
- 1827 Seminole Ln
- 1814 Lark Bunting Ln
- 2 Hilton Ln
- 1909 Mohawk Rd
- 5 Douglas Ln
- 39 Apollo Ln
- 1925 Mohawk Rd
- 2 Alan Shepard Rd Unit 8
- 11 Macnaughton Rd
- 55 Bonnymede Rd Unit S
- 55 Bonnymede Rd
- 55 Bonnymede Rd Unit K
- 130 Scotland Rd Unit D
- 6 Pineridge Ct
- 172 Bonnymede Rd Unit C
- 18 Dundee Ln
- 136 Douglas Ln
- 1739 Jerry Murphy Rd
- 1735 Jerry Murphy Rd
- 1733 Jerry Murphy Rd
- 1741 Jerry Murphy Rd
- 24 Taos Rd
- 22 Taos Rd
- 1731 Jerry Murphy Rd
- 1736 Jerry Murphy Rd
- 1734 Jerry Murphy Rd
- 1738 Jerry Murphy Rd
- 20 Taos Rd
- 1729 Jerry Murphy Rd
- 1740 Jerry Murphy Rd
- 1803 Jerry Murphy Rd
- 18 Taos Rd
- 1802 Yakima Ln
- 1802 Jerry Murphy Rd
- 1805 Midlothian Rd
- 1803 Midlothian Rd
- 1807 Midlothian Rd