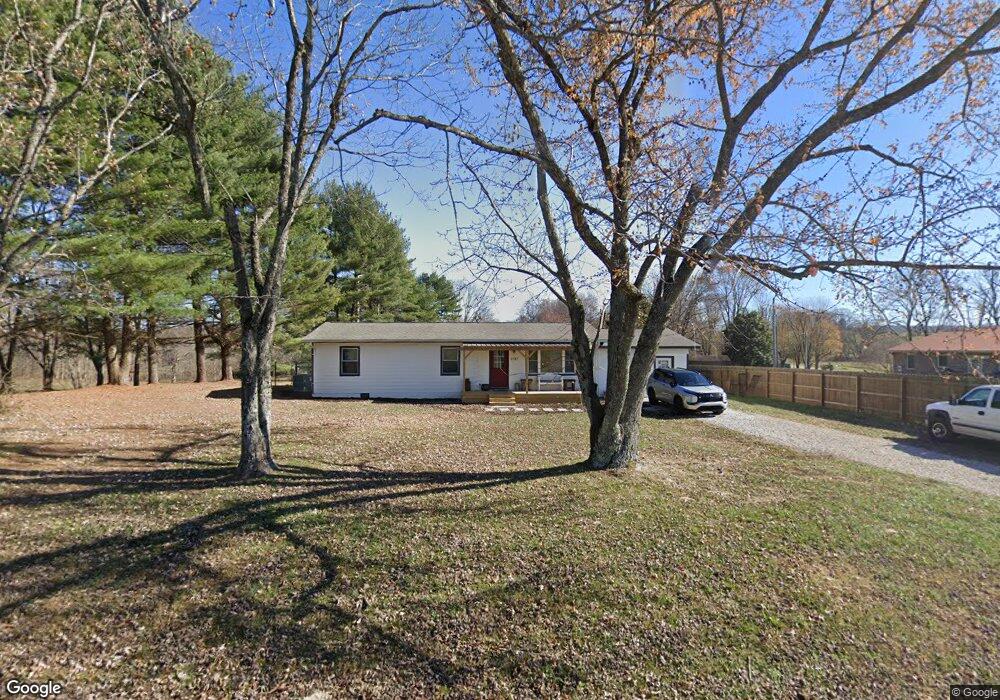
1737 Okolona Rd Rickman, TN 38580
Estimated Value: $147,000 - $256,829
3
Beds
2
Baths
1,152
Sq Ft
$195/Sq Ft
Est. Value
About This Home
This home is located at 1737 Okolona Rd, Rickman, TN 38580 and is currently estimated at $224,457, approximately $194 per square foot. 1737 Okolona Rd is a home located in Overton County.
Ownership History
Date
Name
Owned For
Owner Type
Purchase Details
Closed on
Nov 18, 2024
Sold by
Independence Farms Llc
Bought by
Butler Deanna D
Current Estimated Value
Purchase Details
Closed on
Jul 5, 2024
Sold by
Cheyenne Investments Llc
Bought by
Independence Farms Llc
Purchase Details
Closed on
May 14, 2024
Sold by
Solomon Robert J
Bought by
Cheyenne Investments Llc
Purchase Details
Closed on
May 28, 2015
Sold by
Dailey Mary
Bought by
Davis Margaret A
Home Financials for this Owner
Home Financials are based on the most recent Mortgage that was taken out on this home.
Original Mortgage
$77,900
Interest Rate
3.79%
Mortgage Type
New Conventional
Purchase Details
Closed on
Apr 1, 1977
Bought by
Brown Rassie Deck
Create a Home Valuation Report for This Property
The Home Valuation Report is an in-depth analysis detailing your home's value as well as a comparison with similar homes in the area
Home Values in the Area
Average Home Value in this Area
Purchase History
| Date | Buyer | Sale Price | Title Company |
|---|---|---|---|
| Butler Deanna D | $244,850 | None Listed On Document | |
| Butler Deanna D | $244,850 | None Listed On Document | |
| Butler Deanna D | $244,850 | None Listed On Document | |
| Independence Farms Llc | $145,000 | Foundation Title | |
| Cheyenne Investments Llc | $102,000 | None Listed On Document | |
| Davis Margaret A | $77,900 | -- | |
| Brown Rassie Deck | -- | -- |
Source: Public Records
Mortgage History
| Date | Status | Borrower | Loan Amount |
|---|---|---|---|
| Previous Owner | Davis Margaret A | $77,900 |
Source: Public Records
Tax History Compared to Growth
Tax History
| Year | Tax Paid | Tax Assessment Tax Assessment Total Assessment is a certain percentage of the fair market value that is determined by local assessors to be the total taxable value of land and additions on the property. | Land | Improvement |
|---|---|---|---|---|
| 2024 | $260 | $11,550 | $2,125 | $9,425 |
| 2023 | $228 | $11,550 | $2,125 | $9,425 |
| 2022 | $228 | $11,550 | $2,125 | $9,425 |
| 2021 | $228 | $11,550 | $2,125 | $9,425 |
| 2020 | $228 | $11,550 | $2,125 | $9,425 |
| 2019 | $239 | $10,625 | $1,500 | $9,125 |
| 2018 | $239 | $10,625 | $1,500 | $9,125 |
| 2017 | $222 | $9,875 | $1,500 | $8,375 |
| 2016 | $222 | $9,875 | $1,500 | $8,375 |
| 2015 | $197 | $9,875 | $1,500 | $8,375 |
| 2014 | -- | $9,875 | $1,500 | $8,375 |
| 2013 | -- | $11,225 | $0 | $0 |
Source: Public Records
Map
Nearby Homes
- 175 Lone Oak Dr
- 395 Old Oak Hill Rd
- 673 Rickman Monterey Hwy
- 738 Blue Water Dr
- 352 Rickman Monterey Hwy
- 3272 Rickman Rd
- 139 June Chapel Rd
- 500 Walnut Heights Ln
- 144 Rickman Community Center Rd
- 235 Rickman Monterey Hwy
- 212 Park Rd
- 204 Rickman Monterey Hwy
- Lot 9 Clearfield Ln
- 179 Park Rd
- 0 Clearfield Ln Unit RTC2992177
- 1737 Okalona Rd
- 1741 Okalona Rd
- 113 Oak Hill Cir
- 109 Oak Hill Cir
- 1015 Rickman Monterey Hwy
- 115 Oak Hill Cir
- 1103 Rickman Monterey Hwy
- 1703 Okalona Rd
- 149 Oak Hill Cir
- 6.47ac Rickman Monterey Hwy
- 20.73 AC Tennessee 293
- LOTS 1&2 Tennessee 293
- 00 Tennessee 293
- 160 Oak Hill Cir
- 1121 Rickman Monterey Hwy
- 185 Oak Hill Cir
- 189 Oak Hill Cir
- 179 Oak Hill Cir
- 195 Oak Hill Cir
- 1215 Rickman Monterey Hwy