1737 W Calimyrna Ave Unit 11A Fresno, CA 93711
Bullard NeighborhoodEstimated Value: $321,311 - $406,000
2
Beds
2
Baths
1,549
Sq Ft
$224/Sq Ft
Est. Value
About This Home
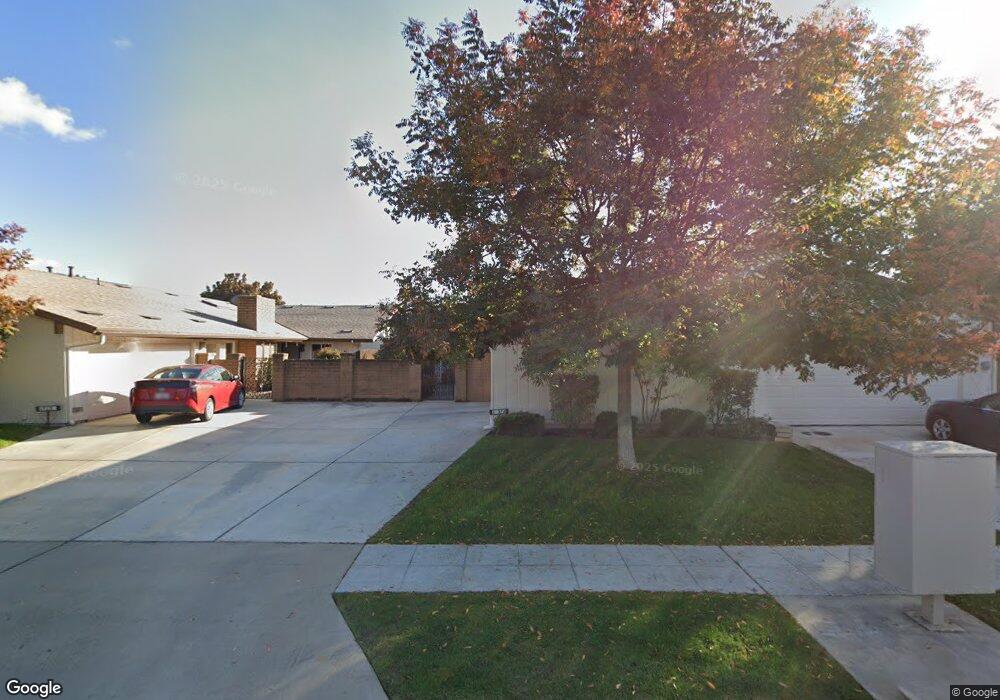
This home is located at 1737 W Calimyrna Ave Unit 11A, Fresno, CA 93711 and is currently estimated at $346,578, approximately $223 per square foot. 1737 W Calimyrna Ave Unit 11A is a home located in Fresno County with nearby schools including Starr Elementary School, Tenaya Middle School, and Bullard High School.
Ownership History
Date
Name
Owned For
Owner Type
Purchase Details
Closed on
Feb 23, 2022
Sold by
Salcedo Claudia I
Bought by
Claudia Salcedo Revocable Trus
Current Estimated Value
Purchase Details
Closed on
Jul 24, 2009
Sold by
Mcalexander Linda and Lenore B Gilfillan Trust
Bought by
Salcedo Claudia I
Home Financials for this Owner
Home Financials are based on the most recent Mortgage that was taken out on this home.
Original Mortgage
$122,400
Interest Rate
5.3%
Mortgage Type
Purchase Money Mortgage
Purchase Details
Closed on
Sep 27, 2001
Sold by
Gilfillan Lenore B
Bought by
Gilfillan Lenore B and Lenore B Gilfillan Trust
Purchase Details
Closed on
Jan 21, 2000
Sold by
Riggs Christine Dresslar and Riggs Christine
Bought by
Gilfillan Lenore B
Home Financials for this Owner
Home Financials are based on the most recent Mortgage that was taken out on this home.
Original Mortgage
$76,800
Interest Rate
8.16%
Create a Home Valuation Report for This Property
The Home Valuation Report is an in-depth analysis detailing your home's value as well as a comparison with similar homes in the area
Home Values in the Area
Average Home Value in this Area
Purchase History
| Date | Buyer | Sale Price | Title Company |
|---|---|---|---|
| Claudia Salcedo Revocable Trus | -- | De Burgh Sean D | |
| Salcedo Claudia I | $153,000 | Chicago Title Company | |
| Gilfillan Lenore B | -- | -- | |
| Gilfillan Lenore B | $96,000 | Financial Title Company |
Source: Public Records
Mortgage History
| Date | Status | Borrower | Loan Amount |
|---|---|---|---|
| Previous Owner | Salcedo Claudia I | $122,400 | |
| Previous Owner | Gilfillan Lenore B | $76,800 |
Source: Public Records
Tax History Compared to Growth
Tax History
| Year | Tax Paid | Tax Assessment Tax Assessment Total Assessment is a certain percentage of the fair market value that is determined by local assessors to be the total taxable value of land and additions on the property. | Land | Improvement |
|---|---|---|---|---|
| 2025 | $2,423 | $197,481 | $49,044 | $148,437 |
| 2023 | $2,282 | $189,815 | $47,141 | $142,674 |
| 2022 | $2,250 | $186,094 | $46,217 | $139,877 |
| 2021 | $2,186 | $182,446 | $45,311 | $137,135 |
| 2020 | $2,176 | $180,576 | $44,847 | $135,729 |
| 2019 | $2,090 | $177,036 | $43,968 | $133,068 |
| 2018 | $2,043 | $173,565 | $43,106 | $130,459 |
| 2017 | $2,004 | $170,000 | $42,000 | $128,000 |
| 2016 | $1,856 | $160,000 | $40,000 | $120,000 |
| 2015 | $1,736 | $150,000 | $37,000 | $113,000 |
| 2014 | $1,736 | $150,000 | $37,000 | $113,000 |
Source: Public Records
Map
Nearby Homes
- 1709 W Calimyrna Ave Unit 9A
- 5740 N West Ave Unit 109
- 2073 W Calimyrna Ave Unit 101
- 6067 N Teilman Ave
- 1545 W Calimyrna Ave
- 2140 W Rue st Michel
- 2058 W Vartikian Ave
- 2157 W Rue st Michel
- 5649 N Romeo Ln
- 1486 W Roberts Ave
- 5811 N Forkner Ave
- 1647 W Wrenwood Ave
- 1387 W Sample Ave
- 1345 W Escalon Ave
- 1326 W Morris Ave
- 6060 N Van Ness Blvd
- 1720 W Barstow Ave
- 1646 W Paul Ave
- 1229 W Bullard Ave Unit 105
- 1665 W Barstow Ave
- 1737 W Calimyrna Ave Unit B
- 1737 W Calimyrna Ave Unit A
- 1737 W Calimyrna Ave Unit 11B
- 1753 W Calimyrna Ave Unit A
- 1753 W Calimyrna Ave
- 1753 W Calimyrna Ave
- 1725 W Calimyrna Ave Unit B
- 1725 W Calimyrna Ave
- 1725 W Calimyrna Ave Unit 10A
- 1767 W Calimyrna Ave
- 1767 W Calimyrna Ave
- 1709 W Calimyrna Ave Unit B
- 1709 W Calimyrna Ave Unit A
- 1709 W Calimyrna Ave
- 1709 W Calimyrna Ave Unit 9B
- 1724 W Bullard Ave
- 1736 W Calimyrna Ave Unit A
- 1736 W Calimyrna Ave
- 1736 W Calimyrna Ave
- 1752 W Calimyrna Ave Unit B