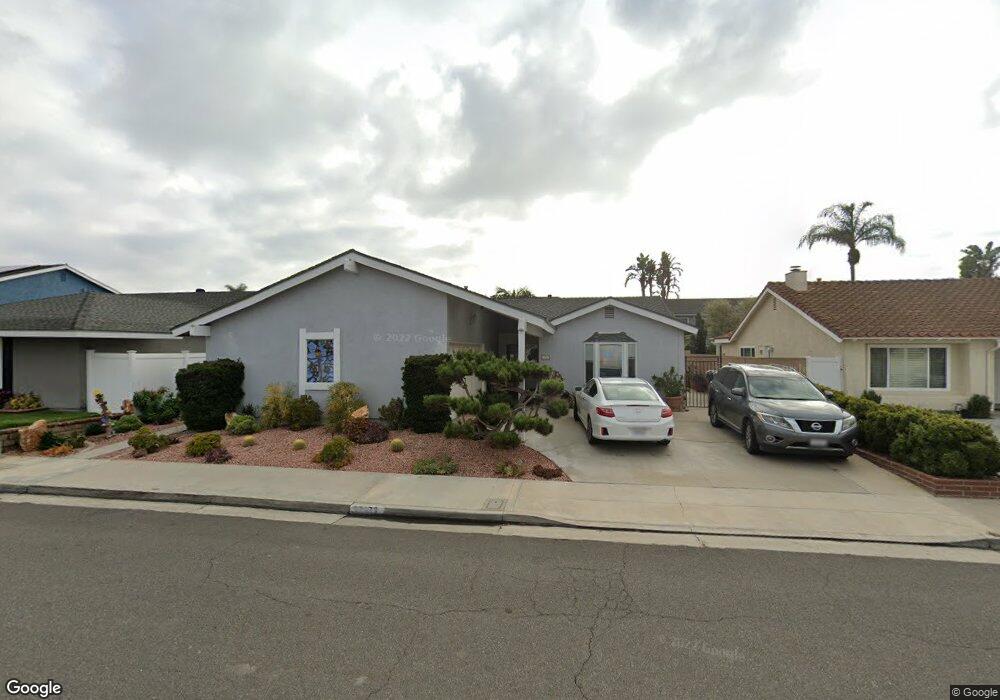
17372 Rob Roy Cir Huntington Beach, CA 92647
Estimated Value: $1,278,558 - $1,664,000
4
Beds
2
Baths
1,624
Sq Ft
$878/Sq Ft
Est. Value
About This Home
This home is located at 17372 Rob Roy Cir, Huntington Beach, CA 92647 and is currently estimated at $1,425,390, approximately $877 per square foot. 17372 Rob Roy Cir is a home located in Orange County with nearby schools including Golden View Elementary School - Environmental Science School, Mesa View Middle School, and Ocean View High.
Ownership History
Date
Name
Owned For
Owner Type
Purchase Details
Closed on
Oct 6, 2023
Sold by
Labelson Ralph and Labelson Linda
Bought by
Labelson Living Trust and Labelson
Current Estimated Value
Purchase Details
Closed on
Jan 24, 2020
Sold by
Labelson Ralph and Labelson Linda
Bought by
Labelson Ralph and Labelson Linda
Home Financials for this Owner
Home Financials are based on the most recent Mortgage that was taken out on this home.
Original Mortgage
$635,310
Interest Rate
3.6%
Mortgage Type
VA
Purchase Details
Closed on
Jan 7, 2020
Sold by
Labelson Ralph and Labelson Linda
Bought by
Labelson Ralph and Labelson Linda
Home Financials for this Owner
Home Financials are based on the most recent Mortgage that was taken out on this home.
Original Mortgage
$635,310
Interest Rate
3.6%
Mortgage Type
VA
Purchase Details
Closed on
Mar 3, 2017
Sold by
Labelson Ralph and Labelson Ralph
Bought by
Labelson Trust & and Labelson Trust
Home Financials for this Owner
Home Financials are based on the most recent Mortgage that was taken out on this home.
Interest Rate
4.1%
Create a Home Valuation Report for This Property
The Home Valuation Report is an in-depth analysis detailing your home's value as well as a comparison with similar homes in the area
Home Values in the Area
Average Home Value in this Area
Purchase History
| Date | Buyer | Sale Price | Title Company |
|---|---|---|---|
| Labelson Living Trust | -- | None Listed On Document | |
| Labelson Ralph | -- | American Coast Title | |
| Labelson Ralph | -- | None Available | |
| Labelson Trust & | -- | -- |
Source: Public Records
Mortgage History
| Date | Status | Borrower | Loan Amount |
|---|---|---|---|
| Previous Owner | Labelson Ralph | $635,310 | |
| Previous Owner | Labelson Trust & | -- |
Source: Public Records
Tax History Compared to Growth
Tax History
| Year | Tax Paid | Tax Assessment Tax Assessment Total Assessment is a certain percentage of the fair market value that is determined by local assessors to be the total taxable value of land and additions on the property. | Land | Improvement |
|---|---|---|---|---|
| 2025 | $1,389 | $99,976 | $35,409 | $64,567 |
| 2024 | $1,389 | $98,016 | $34,715 | $63,301 |
| 2023 | $1,352 | $96,095 | $34,035 | $62,060 |
| 2022 | $1,326 | $94,211 | $33,367 | $60,844 |
| 2021 | $1,302 | $92,364 | $32,713 | $59,651 |
| 2020 | $1,287 | $91,417 | $32,377 | $59,040 |
| 2019 | $1,268 | $89,625 | $31,742 | $57,883 |
| 2018 | $1,242 | $87,868 | $31,119 | $56,749 |
| 2017 | $1,221 | $86,146 | $30,509 | $55,637 |
| 2016 | $1,178 | $84,457 | $29,910 | $54,547 |
| 2015 | $1,159 | $83,189 | $29,461 | $53,728 |
| 2014 | $1,135 | $81,560 | $28,884 | $52,676 |
Source: Public Records
Map
Nearby Homes
- 6611 Crista Palma Dr
- 17261 Gothard St Unit 50
- 17261 Gothard St Unit 67
- 17261 Gothard St Unit 63
- 17261 Gothard St Unit 64
- 6600 Warner Ave Unit 50
- 6600 Warner Ave
- 6600 Warner Ave Unit 142
- 6672 Sun Dr Unit B
- 16892 Limelight Cir Unit B
- 7252 Elk Cir
- 17231 Lido Ln
- 16722 Goldenwest St
- 6301 Warner Ave Unit 40
- 6301 Warner Ave Unit 88
- 17441 Dairyview Cir
- 17071 Pinehurst Ln
- 16542 Sabot Ln
- 16531 Sabot Ln
- 6051 Summerdale Dr
- 17362 Rob Roy Cir
- 17382 Rob Roy Cir
- 17371 Drey Ln
- 17361 Drey Ln
- 17381 Drey Ln
- 17392 Rob Roy Cir
- 17371 Rob Roy Cir
- 17351 Drey Ln
- 17391 Drey Ln
- 17381 Rob Roy Cir
- 17342 Rob Roy Cir
- 17391 Rob Roy Cir
- 17351 Rob Roy Cir
- 17341 Drey Ln
- 6792 Baker Dr
- 17322 Rob Roy Cir
- 17341 Rob Roy Cir
- 6791 Manhattan Dr
- 17372 Drey Ln
- 6832 Manhattan Dr