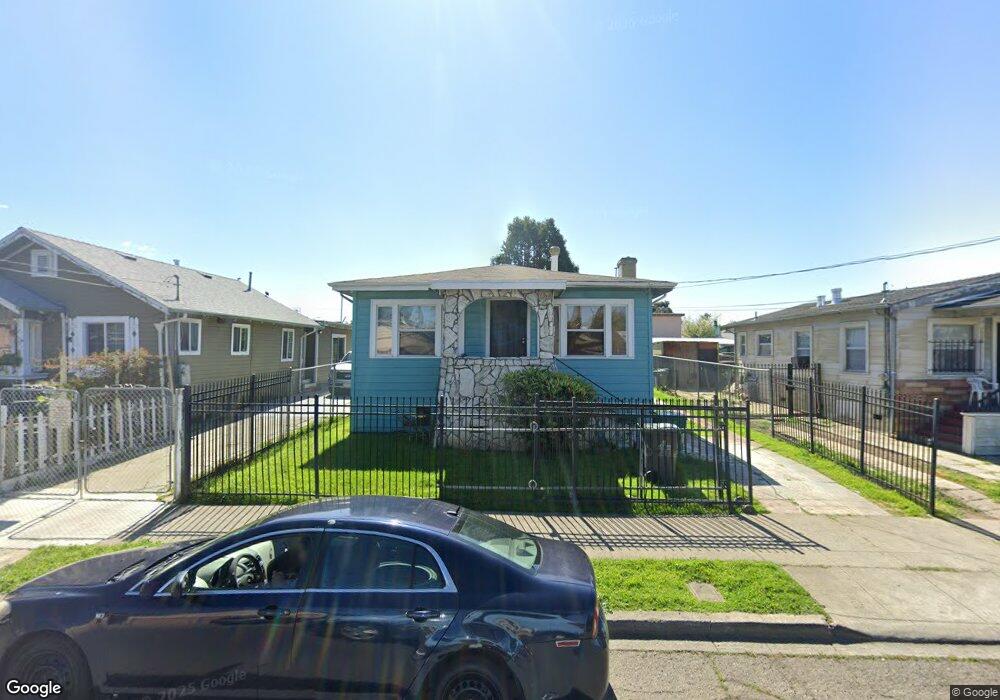
1738 82nd Ave Oakland, CA 94621
Webster NeighborhoodEstimated Value: $461,000 - $543,000
3
Beds
2
Baths
1,087
Sq Ft
$451/Sq Ft
Est. Value
About This Home
This home is located at 1738 82nd Ave, Oakland, CA 94621 and is currently estimated at $489,980, approximately $450 per square foot. 1738 82nd Ave is a home located in Alameda County with nearby schools including East Oakland Pride Elementary School, Coliseum College Prep Academy, and Frick United Academy of Language.
Ownership History
Date
Name
Owned For
Owner Type
Purchase Details
Closed on
Dec 2, 2006
Sold by
Picou Clementine
Bought by
Picou Clementine
Current Estimated Value
Home Financials for this Owner
Home Financials are based on the most recent Mortgage that was taken out on this home.
Original Mortgage
$544,185
Interest Rate
6.51%
Mortgage Type
Reverse Mortgage Home Equity Conversion Mortgage
Purchase Details
Closed on
Jul 30, 1996
Sold by
Picou Robert P
Bought by
Picou Clementine
Create a Home Valuation Report for This Property
The Home Valuation Report is an in-depth analysis detailing your home's value as well as a comparison with similar homes in the area
Home Values in the Area
Average Home Value in this Area
Purchase History
| Date | Buyer | Sale Price | Title Company |
|---|---|---|---|
| Picou Clementine | -- | Fidelity National Financial | |
| Picou Clementine | -- | -- |
Source: Public Records
Mortgage History
| Date | Status | Borrower | Loan Amount |
|---|---|---|---|
| Closed | Picou Clementine | $544,185 |
Source: Public Records
Tax History Compared to Growth
Tax History
| Year | Tax Paid | Tax Assessment Tax Assessment Total Assessment is a certain percentage of the fair market value that is determined by local assessors to be the total taxable value of land and additions on the property. | Land | Improvement |
|---|---|---|---|---|
| 2025 | $2,197 | $80,907 | $34,879 | $53,028 |
| 2024 | $2,197 | $79,183 | $34,195 | $51,988 |
| 2023 | $2,236 | $84,494 | $33,525 | $50,969 |
| 2022 | $2,306 | $75,838 | $32,868 | $49,970 |
| 2021 | $2,503 | $74,213 | $32,223 | $48,990 |
| 2020 | $2,471 | $80,381 | $31,893 | $48,488 |
| 2019 | $2,279 | $78,805 | $31,268 | $47,537 |
| 2018 | $2,230 | $77,260 | $30,655 | $46,605 |
| 2017 | $2,107 | $75,745 | $30,054 | $45,691 |
| 2016 | $1,942 | $74,260 | $29,464 | $44,796 |
| 2015 | $1,923 | $73,145 | $29,022 | $44,123 |
| 2014 | $1,776 | $71,712 | $28,453 | $43,259 |
Source: Public Records
Map
Nearby Homes