Estimated Value: $770,000 - $875,000
3
Beds
2
Baths
1,560
Sq Ft
$515/Sq Ft
Est. Value
About This Home
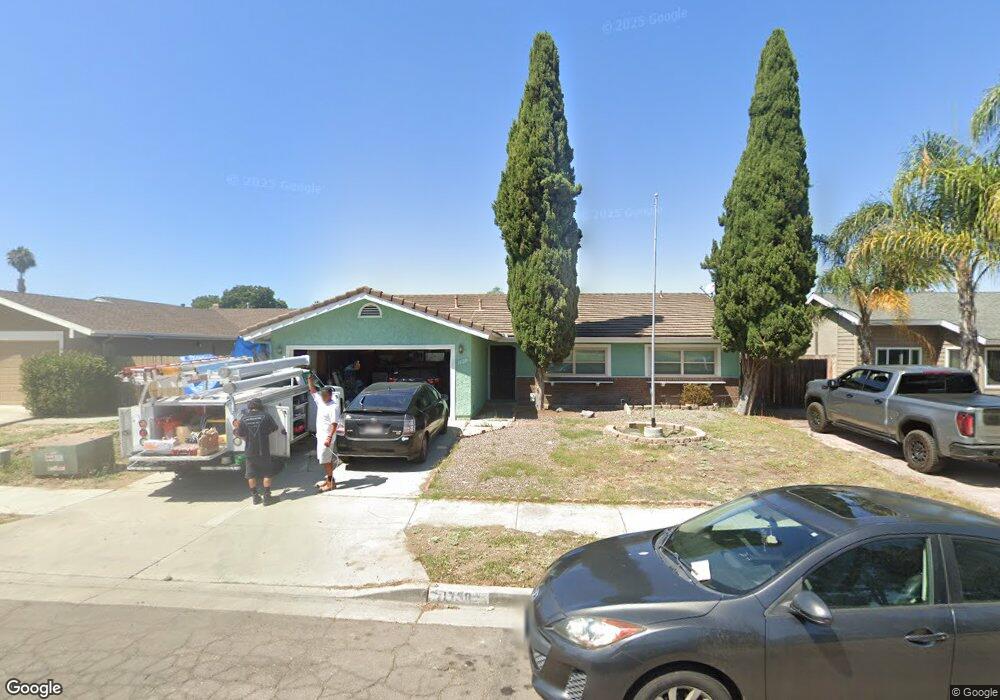
This home is located at 1738 Calle Jules, Vista, CA 92084 and is currently estimated at $803,155, approximately $514 per square foot. 1738 Calle Jules is a home located in San Diego County with nearby schools including Mission Meadows Elementary School, Roosevelt Middle School, and Vista High School.
Ownership History
Date
Name
Owned For
Owner Type
Purchase Details
Closed on
Jun 6, 2006
Sold by
Maze Dennis L and Maze Pamela K
Bought by
Maze Dennis L and Maze Pamela K
Current Estimated Value
Home Financials for this Owner
Home Financials are based on the most recent Mortgage that was taken out on this home.
Original Mortgage
$212,000
Outstanding Balance
$124,569
Interest Rate
6.56%
Mortgage Type
Fannie Mae Freddie Mac
Estimated Equity
$678,586
Purchase Details
Closed on
May 19, 1998
Sold by
Kilroy John D
Bought by
Maze Dennis L and Maze Pamela K
Home Financials for this Owner
Home Financials are based on the most recent Mortgage that was taken out on this home.
Original Mortgage
$163,710
Interest Rate
7.03%
Mortgage Type
VA
Purchase Details
Closed on
Sep 1, 1989
Purchase Details
Closed on
Jan 2, 1986
Create a Home Valuation Report for This Property
The Home Valuation Report is an in-depth analysis detailing your home's value as well as a comparison with similar homes in the area
Home Values in the Area
Average Home Value in this Area
Purchase History
| Date | Buyer | Sale Price | Title Company |
|---|---|---|---|
| Maze Dennis L | -- | Alliance Title Company | |
| Maze Dennis L | $160,500 | Fidelity National Title | |
| -- | $162,900 | -- | |
| -- | $38,500 | -- |
Source: Public Records
Mortgage History
| Date | Status | Borrower | Loan Amount |
|---|---|---|---|
| Open | Maze Dennis L | $212,000 | |
| Previous Owner | Maze Dennis L | $163,710 |
Source: Public Records
Tax History Compared to Growth
Tax History
| Year | Tax Paid | Tax Assessment Tax Assessment Total Assessment is a certain percentage of the fair market value that is determined by local assessors to be the total taxable value of land and additions on the property. | Land | Improvement |
|---|---|---|---|---|
| 2025 | $3,405 | $251,592 | $113,393 | $138,199 |
| 2024 | $3,405 | $246,660 | $111,170 | $135,490 |
| 2023 | $3,339 | $241,825 | $108,991 | $132,834 |
| 2022 | $3,331 | $237,084 | $106,854 | $130,230 |
| 2021 | $3,259 | $232,436 | $104,759 | $127,677 |
| 2020 | $3,235 | $230,053 | $103,685 | $126,368 |
| 2019 | $3,191 | $225,543 | $101,652 | $123,891 |
| 2018 | $5,160 | $221,121 | $99,659 | $121,462 |
| 2017 | $5,095 | $216,786 | $97,705 | $119,081 |
| 2016 | $5,026 | $212,537 | $95,790 | $116,747 |
| 2015 | $5,016 | $209,346 | $94,352 | $114,994 |
| 2014 | $4,948 | $205,246 | $92,504 | $112,742 |
Source: Public Records
Map
Nearby Homes
- 1600 E Vista Way Unit 23
- 1600 E Vista Way Unit 103
- 1600 E Vista Way Unit 110
- 1600 E Vista Way Unit 128
- 1600 E Vista Way Unit 51
- 1600 E Vista Way Unit 38
- 1600 E Vista Way Unit 81
- 1157 Madera Ln Unit 15
- 1501 Anza Ave Unit 39
- 1501 Anza Ave Unit 3
- 1501 Anza Ave Unit 5
- 1501 Anza Ave Unit 72
- 1501 Anza Ave Unit 79
- 1649 San Luis Rey Ave
- 554 Taylor St
- 1010 E Bobier Dr Unit 12
- 1010 E Bobier Dr Unit SPC 81
- 1010 E Bobier Dr Unit 44
- 1010 E Bobier Dr Unit 112
- 1010 E Bobier Dr Unit 59
- 1744 Calle Jules
- 1730 Calle Jules
- 1731 Coyote Ct
- 1752 Calle Jules
- 1724 Calle Jules
- 1737 Coyote Ct
- 1725 Coyote Ct
- 1743 Coyote Ct
- 1711 Calle Jules Unit 6
- 1709 Calle Jules Unit 5
- 1707 Calle Jules Unit 4
- 1701 Calle Jules
- 1745 Calle Jules Unit 23
- 1743 Calle Jules Unit 22
- 1741 Calle Jules Unit 21
- 1739 Calle Jules Unit 20
- 1733 Calle Jules Unit 17
- 1721 Calle Jules Unit 11
- 1719 Calle Jules Unit 10
- 1717 Calle Jules Unit 9