1738 Cedar Johnson Rd West Branch, IA 52358
Estimated Value: $294,000 - $350,646
2
Beds
1
Bath
1,499
Sq Ft
$219/Sq Ft
Est. Value
About This Home
This home is located at 1738 Cedar Johnson Rd, West Branch, IA 52358 and is currently estimated at $328,912, approximately $219 per square foot. 1738 Cedar Johnson Rd is a home located in Cedar County with nearby schools including Hoover Elementary School, West Branch Middle School, and West Branch High School.
Ownership History
Date
Name
Owned For
Owner Type
Purchase Details
Closed on
Jun 29, 2008
Sold by
Yanecek James A and Yanecek Kay L
Bought by
Nelsen Chryse and Nelsen Robert A
Current Estimated Value
Home Financials for this Owner
Home Financials are based on the most recent Mortgage that was taken out on this home.
Original Mortgage
$227,700
Interest Rate
5.93%
Mortgage Type
VA
Purchase Details
Closed on
May 2, 2008
Sold by
Yanecek James A and Yanecek Kay L
Bought by
Nelsen Chryse and Nelsen Robert A
Home Financials for this Owner
Home Financials are based on the most recent Mortgage that was taken out on this home.
Original Mortgage
$227,700
Interest Rate
5.93%
Mortgage Type
VA
Create a Home Valuation Report for This Property
The Home Valuation Report is an in-depth analysis detailing your home's value as well as a comparison with similar homes in the area
Home Values in the Area
Average Home Value in this Area
Purchase History
| Date | Buyer | Sale Price | Title Company |
|---|---|---|---|
| Nelsen Chryse | -- | None Available | |
| Nelsen Chryse | $250,000 | None Available |
Source: Public Records
Mortgage History
| Date | Status | Borrower | Loan Amount |
|---|---|---|---|
| Previous Owner | Nelsen Chryse | $227,700 |
Source: Public Records
Tax History Compared to Growth
Tax History
| Year | Tax Paid | Tax Assessment Tax Assessment Total Assessment is a certain percentage of the fair market value that is determined by local assessors to be the total taxable value of land and additions on the property. | Land | Improvement |
|---|---|---|---|---|
| 2025 | $3,508 | $341,200 | $136,200 | $205,000 |
| 2024 | $3,508 | $312,560 | $107,400 | $205,160 |
| 2023 | $3,368 | $300,460 | $107,400 | $193,060 |
| 2022 | $3,130 | $237,750 | $73,130 | $164,620 |
| 2021 | $2,984 | $237,750 | $73,130 | $164,620 |
| 2020 | $2,900 | $211,330 | $65,000 | $146,330 |
| 2019 | $2,544 | $206,990 | $65,000 | $146,330 |
| 2018 | $2,488 | $206,990 | $0 | $0 |
| 2017 | $2,488 | $185,030 | $0 | $0 |
| 2016 | $2,438 | $185,030 | $0 | $0 |
| 2015 | $2,464 | $185,030 | $0 | $0 |
| 2014 | $2,464 | $186,640 | $0 | $0 |
Source: Public Records
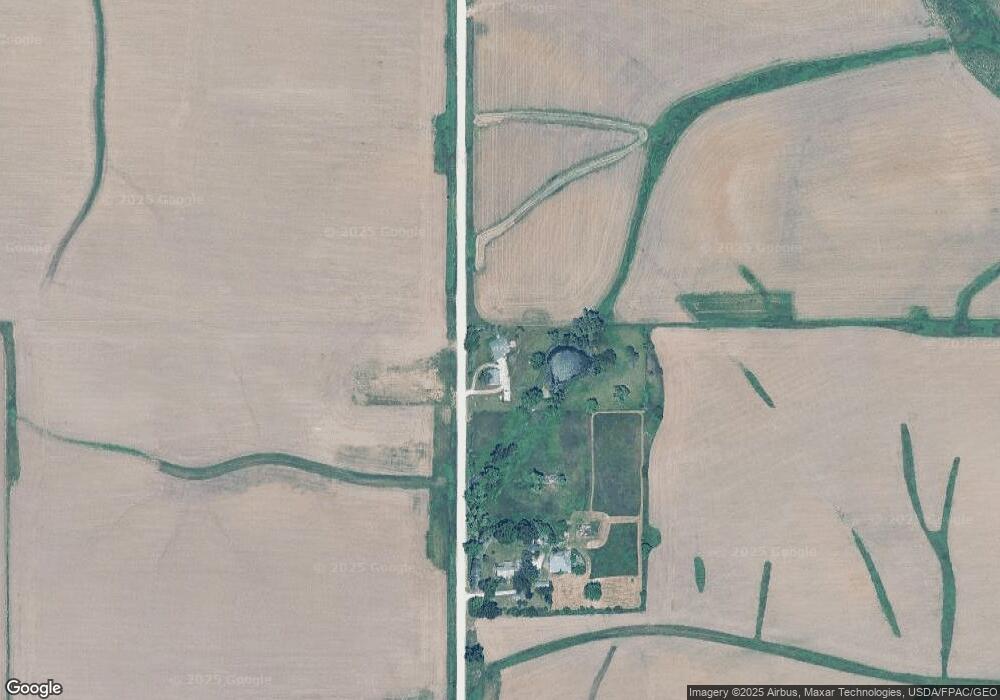
Map
Nearby Homes
- 0 340th St NE Unit 2507765
- 0 122 Acres M L Cedar Johnson Rd
- 4 Lazy Brook Dr
- 2 Lazy Brook Dr
- 1 Ember Ln
- 3149 Oasis Rd NE
- 122 acres m/l Cedar Johnson Rd
- Lot 17 the Meadows Subdivision Part 5
- Lot 17 Meadows Subdivision Part 5
- 436 Dawson Dr
- 27 Bradley Ln Unit AC27
- 817 Prairie View Dr
- 12 Bradley Ln Unit AB12
- 719 Sullivan St
- 63 Eisenhower St Unit GB63
- 609 W Orange St
- 33 Lou Henry Ln Unit AM33
- 35 Lou Henry Ln Unit AM35
- Lot 4 Meadows Subdivision Part 6
- Lot 12 Meadows Subdivision Part 6
- 1740 Cedar Johnson Rd
- 3255 Johnson Cedar Rd NE
- 1754 Cedar Johnson Rd
- 1704 Cedar Johnson Rd
- 1696 Cedar Johnson Rd
- 1660 Cedar Johnson Rd
- 3385 Johnson Cedar Rd NE
- 0 340th St NE Unit 2305900
- 11 265th St
- 0 280th St
- 5721 310th St NE
- 26 280th St
- 59 280th St
- 1723 Baker Ave
- 5688 340th St NE
- 1747 Baker Ave
- 1745 Baker Ave
- 1743 Baker Ave