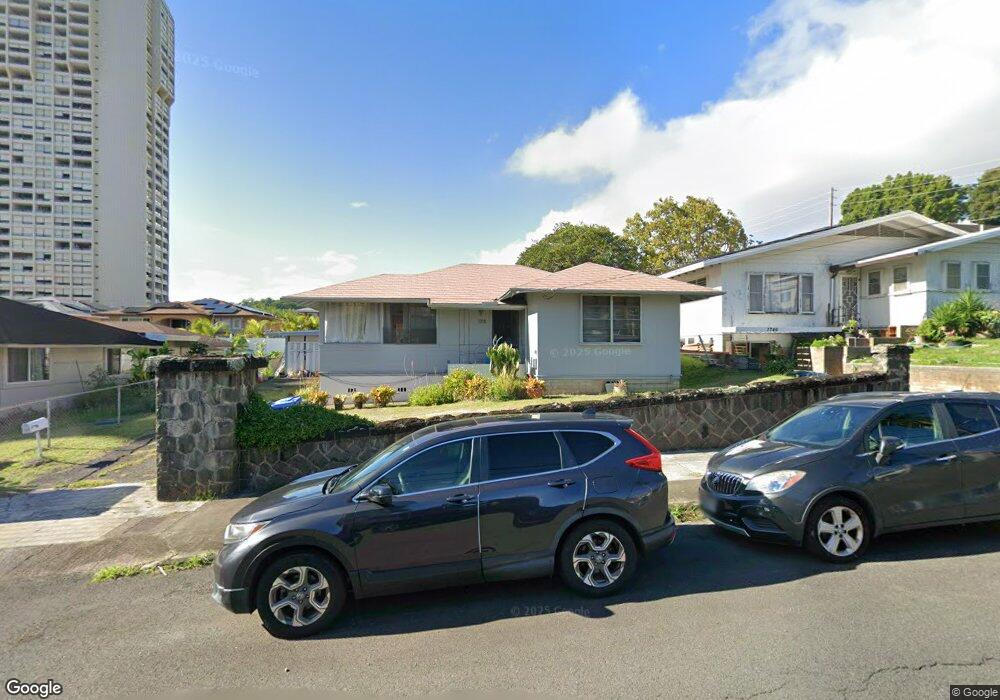
1738 Kewalo St Honolulu, HI 96822
Makiki NeighborhoodEstimated Value: $1,059,000 - $1,419,000
4
Beds
1
Bath
896
Sq Ft
$1,394/Sq Ft
Est. Value
About This Home
This home is located at 1738 Kewalo St, Honolulu, HI 96822 and is currently estimated at $1,249,355, approximately $1,394 per square foot. 1738 Kewalo St is a home located in Honolulu County with nearby schools including President Abraham Lincoln Elementary School, Robert Louis Stevenson Middle School, and President Theodore Roosevelt High School.
Ownership History
Date
Name
Owned For
Owner Type
Purchase Details
Closed on
Jul 19, 2022
Sold by
Arthur Wong Living Trust
Bought by
Wong Derek Wai Chew and Wong Thao Thanh
Current Estimated Value
Purchase Details
Closed on
Jun 12, 2014
Sold by
Yoshioka Melissa Yee Ling and Yoshioka Blaine Ken
Bought by
Wong Derek Wai Chew and Wong Thao Thanh Thi
Purchase Details
Closed on
Jan 24, 2013
Sold by
Yoshioka Melissa Yee Ling and Yoshioka Blaine Ken
Bought by
Wong Derek Wai Chew and Wong Thao Thanh Thi
Purchase Details
Closed on
Dec 13, 2012
Sold by
Yoshioka Melissa Yee Ling and Yoshioka Blaine Ken
Bought by
Wong Derek Wai Chew and Wong Thao Thanh Thi
Purchase Details
Closed on
Jan 6, 1997
Sold by
Wong Arthur Gee Hing and Wong Derek Wai Chew
Bought by
Wong Arthur G H and Wong Derek Wai Chew
Create a Home Valuation Report for This Property
The Home Valuation Report is an in-depth analysis detailing your home's value as well as a comparison with similar homes in the area
Home Values in the Area
Average Home Value in this Area
Purchase History
| Date | Buyer | Sale Price | Title Company |
|---|---|---|---|
| Wong Derek Wai Chew | -- | -- | |
| Wong Derek Wai Chew | -- | None Available | |
| Wong Derek Wai Chew | -- | None Available | |
| Wong Derek Wai Chew | -- | None Available | |
| Wong Derek Wai Chew | -- | None Available | |
| Wong Derek Wai Chew | -- | None Available | |
| Wong Derek Wai Chew | -- | None Available | |
| Wong Derek Wai Chew | -- | None Available | |
| Yoshioka Blaine Ken | -- | None Available | |
| Wong Derek Wai Chew | -- | None Available | |
| Wong Derek Wai Chew | -- | None Available | |
| Wong Derek Wai Chew | -- | None Available | |
| Yoshioka Blaine Ken | -- | None Available | |
| Wong Arthur G H | -- | -- |
Source: Public Records
Tax History Compared to Growth
Tax History
| Year | Tax Paid | Tax Assessment Tax Assessment Total Assessment is a certain percentage of the fair market value that is determined by local assessors to be the total taxable value of land and additions on the property. | Land | Improvement |
|---|---|---|---|---|
| 2025 | $8,445 | $1,413,800 | $1,306,800 | $107,000 |
| 2024 | $8,445 | $1,389,900 | $1,265,200 | $124,700 |
| 2023 | $6,934 | $1,268,600 | $1,217,700 | $50,900 |
| 2022 | $3,094 | $1,048,900 | $1,009,800 | $39,100 |
| 2021 | $2,977 | $1,015,500 | $1,009,800 | $5,700 |
| 2020 | $3,367 | $1,127,100 | $974,200 | $152,900 |
| 2019 | $3,684 | $1,197,600 | $974,200 | $223,400 |
| 2018 | $2,995 | $1,020,600 | $974,200 | $46,400 |
| 2017 | $3,134 | $1,040,400 | $891,000 | $149,400 |
| 2016 | $2,778 | $938,700 | $861,300 | $77,400 |
| 2015 | $2,725 | $923,600 | $784,100 | $139,500 |
| 2014 | $2,086 | $850,200 | $748,400 | $101,800 |
Source: Public Records
Map
Nearby Homes
- 1702 Kewalo St Unit 508
- 1702 Kewalo St Unit 204
- 1717 Mott Smith Dr Unit 2304
- 1717 Mott Smith Dr Unit 3206
- 1214 Nehoa St Unit A
- 1302 Nehoa St
- 1642 Kewalo St Unit 202
- 1639 Liholiho St
- 1332 Nehoa St
- 1333 Heulu St Unit 808
- 1333 Heulu St Unit 901
- 1929 Nehoa Place Unit A
- 1929 Nehoa Place Unit C
- 1630 Liholiho St Unit 1701
- 1630 Liholiho St Unit 2309
- 1630 Liholiho St Unit 506
- 1630 Liholiho St Unit 2001
- 1630 Liholiho St Unit 1203
- 1630 Liholiho St Unit 2205
- 1630 Liholiho St Unit 1403
- 1746 Kewalo St
- 1730 Kewalo St
- 1257 Nehoa St
- 1726 Kewalo St
- 1265 Nehoa St
- 1251 Nehoa St
- 1303 Dominis St
- 1724 Kewalo St Unit A
- 1724 Kewalo St Unit B
- 1724 Kewalo St
- 1805 Kewalo St
- 1245 Nehoa St Unit 1708
- 1310 Dominis St
- 1721 Kewalo St
- 1311 Dominis St
- 1717 Kewalo St
- 1316 Dominis St
- 1264 Nehoa St
- 1702 Kewalo St Unit 702
- 1702 Kewalo St Unit 1101