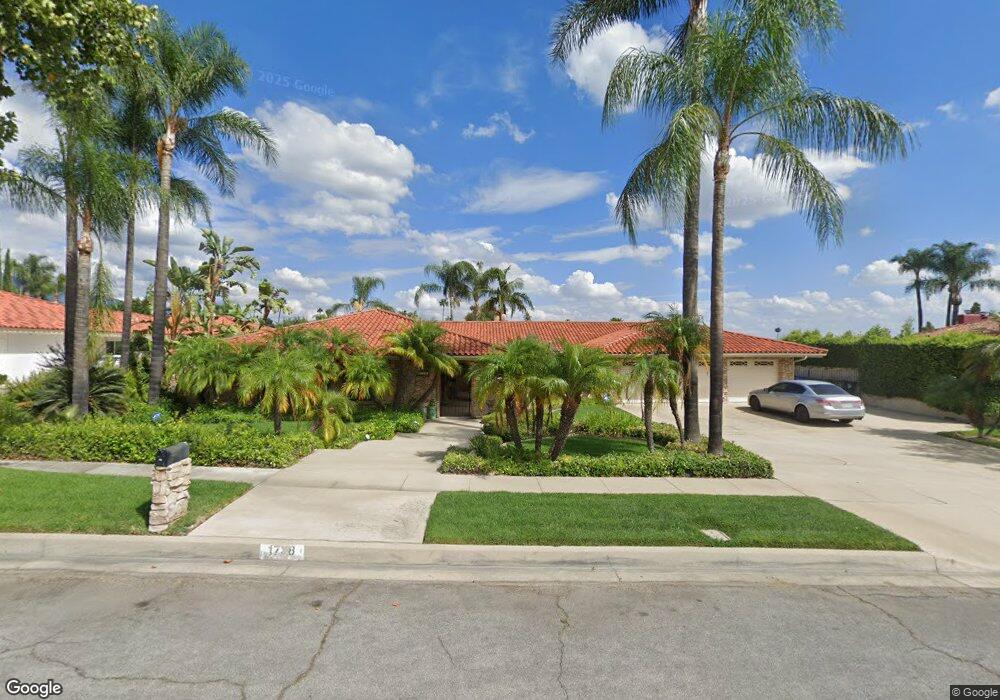
1738 N Tulare Way Upland, CA 91784
Estimated Value: $1,439,000 - $1,620,000
4
Beds
3
Baths
3,621
Sq Ft
$415/Sq Ft
Est. Value
About This Home
This home is located at 1738 N Tulare Way, Upland, CA 91784 and is currently estimated at $1,500,914, approximately $414 per square foot. 1738 N Tulare Way is a home located in San Bernardino County with nearby schools including Magnolia Elementary, Pioneer Junior High School, and Upland High School.
Ownership History
Date
Name
Owned For
Owner Type
Purchase Details
Closed on
Sep 11, 2023
Sold by
Senior David Harlon Morgan and Senior Shanda Deni
Bought by
Morgan Revocable Living Trust and Senior
Current Estimated Value
Purchase Details
Closed on
Jul 13, 2007
Sold by
Tuckley Brian
Bought by
Morgan David H and Morgan Shanda D
Home Financials for this Owner
Home Financials are based on the most recent Mortgage that was taken out on this home.
Original Mortgage
$720,000
Interest Rate
6.73%
Mortgage Type
Negative Amortization
Purchase Details
Closed on
Jan 5, 2000
Sold by
Castaldi Sabina H Tr
Bought by
Tuckley Brian and Tuckley Myrna
Home Financials for this Owner
Home Financials are based on the most recent Mortgage that was taken out on this home.
Original Mortgage
$175,000
Interest Rate
7.84%
Create a Home Valuation Report for This Property
The Home Valuation Report is an in-depth analysis detailing your home's value as well as a comparison with similar homes in the area
Home Values in the Area
Average Home Value in this Area
Purchase History
| Date | Buyer | Sale Price | Title Company |
|---|---|---|---|
| Morgan Revocable Living Trust | -- | None Listed On Document | |
| Morgan David H | $900,000 | Fidelity National Title Co | |
| Tuckley Brian | $405,000 | Lawyers Title Company |
Source: Public Records
Mortgage History
| Date | Status | Borrower | Loan Amount |
|---|---|---|---|
| Previous Owner | Morgan David H | $720,000 | |
| Previous Owner | Tuckley Brian | $175,000 |
Source: Public Records
Tax History Compared to Growth
Tax History
| Year | Tax Paid | Tax Assessment Tax Assessment Total Assessment is a certain percentage of the fair market value that is determined by local assessors to be the total taxable value of land and additions on the property. | Land | Improvement |
|---|---|---|---|---|
| 2025 | $19,760 | $1,205,814 | $422,035 | $783,779 |
| 2024 | $19,760 | $1,182,171 | $413,760 | $768,411 |
| 2023 | $12,541 | $1,158,991 | $405,647 | $753,344 |
| 2022 | $12,273 | $1,136,266 | $397,693 | $738,573 |
| 2021 | $12,266 | $1,113,986 | $389,895 | $724,091 |
| 2020 | $11,933 | $1,102,563 | $385,897 | $716,666 |
| 2019 | $11,892 | $1,080,944 | $378,330 | $702,614 |
| 2018 | $11,598 | $1,059,749 | $370,912 | $688,837 |
| 2017 | $11,264 | $1,038,969 | $363,639 | $675,330 |
| 2016 | $10,971 | $1,018,597 | $356,509 | $662,088 |
| 2015 | $10,355 | $969,000 | $339,000 | $630,000 |
| 2014 | $9,283 | $874,000 | $306,000 | $568,000 |
Source: Public Records
Map
Nearby Homes
- 1754 N Tulare Way
- 256 W 18th St
- 1817 N Vallejo Way
- 1629 N Palm Ave
- 1623 N Vallejo Way
- 882 W 17th St
- 1788 N Coolcrest Ave
- 1604 N Laurel Ave
- 1817 Balboa Way
- 1931 N Redding Way
- 1844 N 1st Ave
- 322 E 19th St
- 388 Harford Place
- 1099 Sullivan St
- 1146 Oneil St
- 1547 Shamrock Ave
- 1669 Erin Ave
- 1613 Erin Ave
- 1018 W 15th St
- 1226 Azalea Ct
- 1728 N Tulare Way
- 1746 N Tulare Way
- 1737 N Redding Way
- 1729 N Redding Way
- 1720 N Tulare Way
- 1729 N Tulare Way
- 1749 N Tulare Way
- 1721 N Redding Way
- 1753 N Redding Way
- 1719 N Tulare Way
- 1712 N Tulare Way
- 1755 N Tulare Way
- 1728 N Ukiah Way
- 1713 N Redding Way
- 480 W Clark St
- 450 W Clark St
- 1750 N Ukiah Way
- 1738 N Redding Way
- 428 W Clark St
- 1720 N Ukiah Way