Estimated Value: $654,000 - $707,000
4
Beds
4
Baths
4,129
Sq Ft
$163/Sq Ft
Est. Value
About This Home
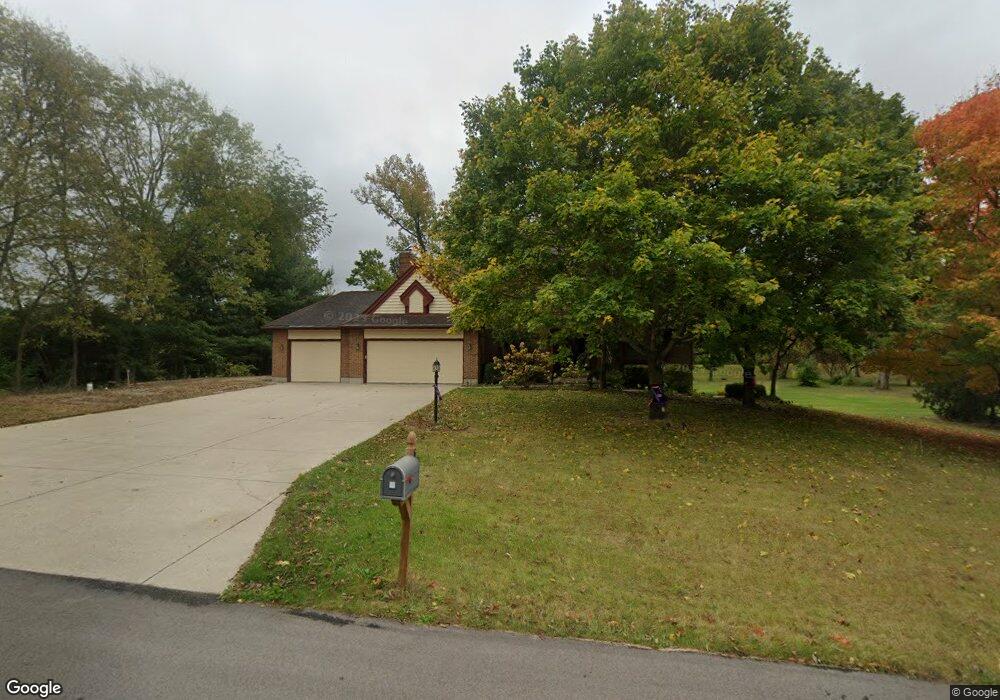
This home is located at 1738 Woodland Trail, Xenia, OH 45385 and is currently estimated at $671,198, approximately $162 per square foot. 1738 Woodland Trail is a home located in Greene County with nearby schools including Trebein Elementary School, Jacob Coy Middle School, and Beavercreek High School.
Ownership History
Date
Name
Owned For
Owner Type
Purchase Details
Closed on
Jul 7, 2021
Sold by
Lewis Theodore P and Lewis Marcia J
Bought by
Palchoudhury Soubantika and Melnyczuk John M
Current Estimated Value
Home Financials for this Owner
Home Financials are based on the most recent Mortgage that was taken out on this home.
Original Mortgage
$430,000
Outstanding Balance
$390,515
Interest Rate
2.96%
Mortgage Type
New Conventional
Estimated Equity
$280,683
Purchase Details
Closed on
Jun 3, 2008
Sold by
Werth Gary G and Werth Dalma M
Bought by
Lewis Theodore P and Lewis Marcia J
Home Financials for this Owner
Home Financials are based on the most recent Mortgage that was taken out on this home.
Original Mortgage
$125,000
Interest Rate
4.62%
Mortgage Type
Unknown
Create a Home Valuation Report for This Property
The Home Valuation Report is an in-depth analysis detailing your home's value as well as a comparison with similar homes in the area
Home Values in the Area
Average Home Value in this Area
Purchase History
| Date | Buyer | Sale Price | Title Company |
|---|---|---|---|
| Palchoudhury Soubantika | -- | None Listed On Document | |
| Lewis Theodore P | $387,000 | Attorney |
Source: Public Records
Mortgage History
| Date | Status | Borrower | Loan Amount |
|---|---|---|---|
| Open | Palchoudhury Soubantika | $430,000 | |
| Previous Owner | Lewis Theodore P | $125,000 |
Source: Public Records
Tax History Compared to Growth
Tax History
| Year | Tax Paid | Tax Assessment Tax Assessment Total Assessment is a certain percentage of the fair market value that is determined by local assessors to be the total taxable value of land and additions on the property. | Land | Improvement |
|---|---|---|---|---|
| 2024 | $9,287 | $164,890 | $31,580 | $133,310 |
| 2023 | $9,287 | $164,890 | $31,580 | $133,310 |
| 2022 | $8,553 | $133,130 | $22,550 | $110,580 |
| 2021 | $8,808 | $133,130 | $22,550 | $110,580 |
| 2020 | $8,850 | $133,130 | $22,550 | $110,580 |
| 2019 | $9,303 | $128,520 | $17,860 | $110,660 |
| 2018 | $8,134 | $128,520 | $17,860 | $110,660 |
| 2017 | $7,982 | $128,520 | $17,860 | $110,660 |
| 2016 | $7,472 | $116,430 | $17,860 | $98,570 |
| 2015 | $7,519 | $116,430 | $17,860 | $98,570 |
| 2014 | $7,349 | $116,430 | $17,860 | $98,570 |
Source: Public Records
Map
Nearby Homes
- 1800 Ash Meadow Ct
- 1481 Stone Ridge Ct
- 2447 Hawes Dr
- 2068 Creswell Dr
- 2067 Codaz Way
- Hudson Plan at Nathanials Grove Estates
- Cumberland Plan at Nathanials Grove Estates
- Lehigh Plan at Nathanials Grove Estates
- Ballenger Plan at Nathanials Grove Estates
- Aviano Plan at Nathanials Grove Estates
- Allegheny Plan at Nathanials Grove Estates
- 2450 Beaver Valley Rd
- 1878 Spring Meadows Dr
- 2170 Schmidt Dr N
- 1678 Fairground Rd
- 1922 Spring Ridge Dr
- 1788 Fawnwood Ct
- 1281 Whitetail Dr
- 1105 Windsong Trail
- 2544 Golden Leaf Dr
- 1736 Woodland Trail
- 1743 Woodland Trail
- 1745 Woodland Trail
- 1741 Woodland Trail
- 1734 Woodland Trail
- 1714 Grand Portage Trail
- 1746 Grand Portage Trail
- 1739 Woodland Trail
- 1671 Grand Portage Trail
- 1756 Grand Portage Trail
- 1775 Ash Meadow Ct
- 1690 Grand Portage Trail
- 1728 Woodland Trail
- 1778 Ash Meadow Ct
- 1750 Cedarland Ct
- 1791 Ash Meadow Ct
- 2369 Passage Key Trail
- 1694 Woodland Trail
- 2289 Walnut Ct
- 1788 Grand Portage Trail