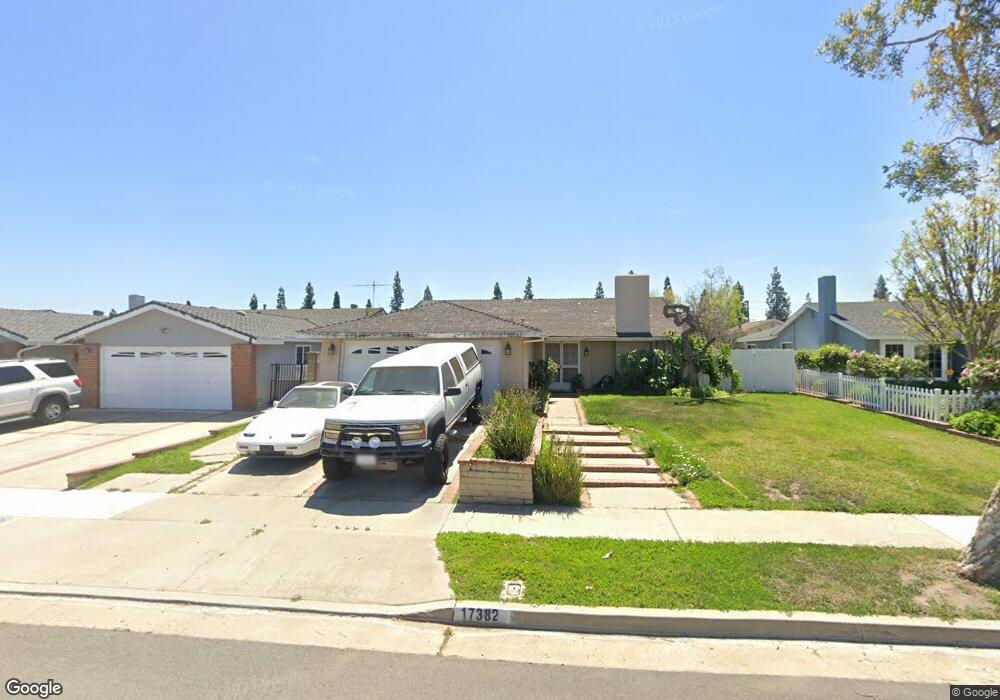
17382 Yorkshire Ave Yorba Linda, CA 92886
Estimated Value: $1,047,000 - $1,107,000
4
Beds
2
Baths
1,440
Sq Ft
$742/Sq Ft
Est. Value
About This Home
This home is located at 17382 Yorkshire Ave, Yorba Linda, CA 92886 and is currently estimated at $1,068,929, approximately $742 per square foot. 17382 Yorkshire Ave is a home located in Orange County with nearby schools including Van Buren Elementary School, Kraemer Middle School, and Valencia High School.
Ownership History
Date
Name
Owned For
Owner Type
Purchase Details
Closed on
May 21, 2013
Sold by
Salvatore Philip J and Salvatore Sheila
Bought by
Salvatore Philip J and Salvaore Sheila
Current Estimated Value
Purchase Details
Closed on
Dec 6, 1995
Sold by
Vargas Jose S and Vargas Gloria D
Bought by
Noonan Michael P
Home Financials for this Owner
Home Financials are based on the most recent Mortgage that was taken out on this home.
Original Mortgage
$171,027
Outstanding Balance
$3,499
Interest Rate
7.37%
Mortgage Type
Assumption
Estimated Equity
$1,065,430
Purchase Details
Closed on
Nov 16, 1995
Sold by
Noonan Michael P
Bought by
Noonan Michael P and Noonan Cathy Palamara
Home Financials for this Owner
Home Financials are based on the most recent Mortgage that was taken out on this home.
Original Mortgage
$171,027
Outstanding Balance
$3,499
Interest Rate
7.37%
Mortgage Type
Assumption
Estimated Equity
$1,065,430
Create a Home Valuation Report for This Property
The Home Valuation Report is an in-depth analysis detailing your home's value as well as a comparison with similar homes in the area
Home Values in the Area
Average Home Value in this Area
Purchase History
| Date | Buyer | Sale Price | Title Company |
|---|---|---|---|
| Salvatore Philip J | -- | None Available | |
| Noonan Michael P | $178,500 | Old Republic Title Company | |
| Noonan Michael P | -- | Orange Coast Title Companies | |
| Noonan Michael P | -- | Old Republic Title Company |
Source: Public Records
Mortgage History
| Date | Status | Borrower | Loan Amount |
|---|---|---|---|
| Open | Noonan Michael P | $171,027 |
Source: Public Records
Tax History Compared to Growth
Tax History
| Year | Tax Paid | Tax Assessment Tax Assessment Total Assessment is a certain percentage of the fair market value that is determined by local assessors to be the total taxable value of land and additions on the property. | Land | Improvement |
|---|---|---|---|---|
| 2025 | $3,645 | $296,523 | $178,955 | $117,568 |
| 2024 | $3,645 | $290,709 | $175,446 | $115,263 |
| 2023 | $3,568 | $285,009 | $172,006 | $113,003 |
| 2022 | $3,517 | $279,421 | $168,633 | $110,788 |
| 2021 | $3,450 | $273,943 | $165,327 | $108,616 |
| 2020 | $3,335 | $271,135 | $163,632 | $107,503 |
| 2019 | $3,229 | $265,819 | $160,423 | $105,396 |
| 2018 | $3,187 | $260,607 | $157,277 | $103,330 |
| 2017 | $3,134 | $255,498 | $154,194 | $101,304 |
| 2016 | $3,072 | $250,489 | $151,171 | $99,318 |
| 2015 | $3,033 | $246,727 | $148,900 | $97,827 |
| 2014 | $2,945 | $241,894 | $145,983 | $95,911 |
Source: Public Records
Map
Nearby Homes
- 17225 Orange Blossom Ln
- 5130 Webb Place
- 5661 Casa Loma Ave
- 1524 Larsen Ln
- 1527 Evans Ln
- 17842 Caballo Dr
- 17841 Buena Vista Ave
- 5141 Siesta Ln
- 5231 Highland Ave
- 17001 La Kenice Way
- 1261 Desoto St
- 1561 Ismail Place
- 732 Olivier Dr
- 726 Olivier Dr
- 718 Olivier Dr
- 714 Olivier Dr
- 727 Olivier Dr
- 708 Mcfadden St
- 582 Mcfadden St
- 707 Olivier Dr
- 17392 Yorkshire Ave
- 17372 Yorkshire Ave
- 17371 Melbourne Ln
- 17412 Yorkshire Ave
- 17362 Yorkshire Ave
- 17391 Melbourne Ln
- 17361 Melbourne Ln
- 17411 Melbourne Ln
- 17422 Yorkshire Ave
- 17352 Yorkshire Ave
- 17371 Yorkshire Ave
- 17391 Yorkshire Ave
- 17351 Melbourne Ln
- 17421 Melbourne Ln
- 17361 Yorkshire Ave
- 17411 Yorkshire Ave
- 17342 Yorkshire Ave
- 17432 Yorkshire Ave
- 17341 Melbourne Ln
- 17421 Yorkshire Ave