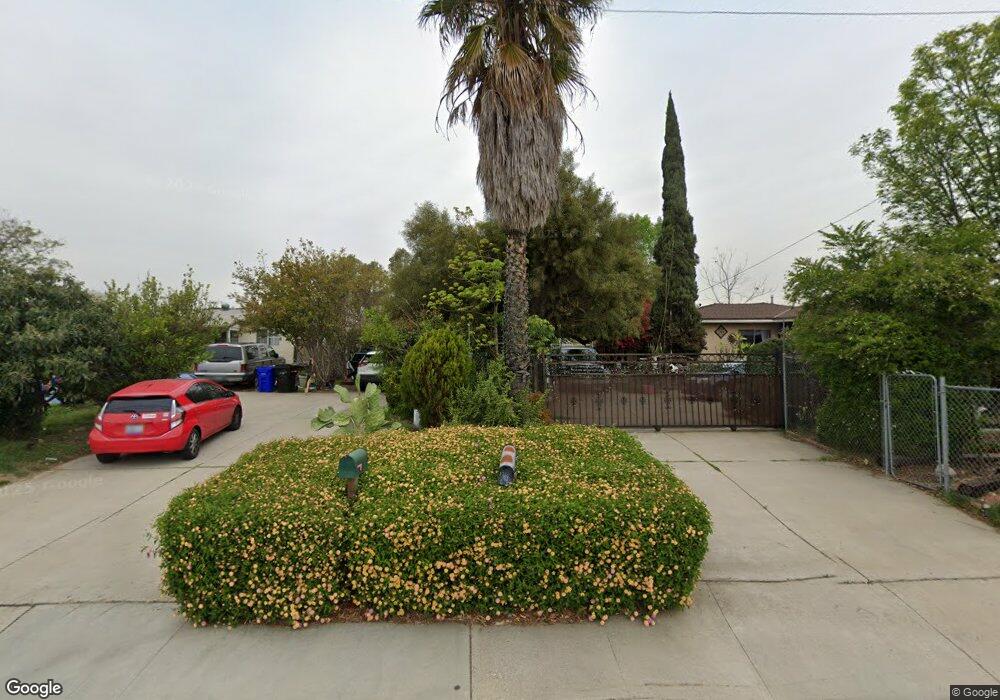
17386 Merrill Ave Fontana, CA 92335
Estimated Value: $501,000 - $545,000
2
Beds
2
Baths
1,080
Sq Ft
$489/Sq Ft
Est. Value
About This Home
This home is located at 17386 Merrill Ave, Fontana, CA 92335 and is currently estimated at $528,010, approximately $488 per square foot. 17386 Merrill Ave is a home located in San Bernardino County with nearby schools including South Tamarind Elementary School, Fontana Middle School, and Jurupa Hills High School.
Ownership History
Date
Name
Owned For
Owner Type
Purchase Details
Closed on
Mar 31, 2001
Sold by
Hud
Bought by
Jordan Forrest and Jordan Aurora C
Current Estimated Value
Home Financials for this Owner
Home Financials are based on the most recent Mortgage that was taken out on this home.
Original Mortgage
$85,260
Interest Rate
7.15%
Mortgage Type
FHA
Purchase Details
Closed on
Oct 26, 2000
Sold by
Chase Manhattan Mtg Corp
Bought by
Hud
Purchase Details
Closed on
Nov 13, 1998
Sold by
Saldivar Jose Eleuterio
Bought by
Saldivar Maria R
Purchase Details
Closed on
Aug 19, 1998
Sold by
Street Michael B
Bought by
Santillan Elizabeth and Saldivar Maria R
Home Financials for this Owner
Home Financials are based on the most recent Mortgage that was taken out on this home.
Original Mortgage
$95,854
Interest Rate
6.84%
Mortgage Type
FHA
Purchase Details
Closed on
May 12, 1998
Sold by
Perez Leslie H
Bought by
Street Michael B and The Merrill Avenue Trust
Create a Home Valuation Report for This Property
The Home Valuation Report is an in-depth analysis detailing your home's value as well as a comparison with similar homes in the area
Home Values in the Area
Average Home Value in this Area
Purchase History
| Date | Buyer | Sale Price | Title Company |
|---|---|---|---|
| Jordan Forrest | $101,000 | Fidelity National Title | |
| Hud | -- | Fidelity Title | |
| Chase Manhattan Mtg Corp | $102,968 | Fidelity National Title | |
| Saldivar Maria R | -- | Fidelity Title | |
| Santillan Elizabeth | $96,000 | Fidelity Title | |
| Street Michael B | $50,000 | Fidelity National Title |
Source: Public Records
Mortgage History
| Date | Status | Borrower | Loan Amount |
|---|---|---|---|
| Previous Owner | Jordan Forrest | $85,260 | |
| Previous Owner | Santillan Elizabeth | $95,854 |
Source: Public Records
Tax History Compared to Growth
Tax History
| Year | Tax Paid | Tax Assessment Tax Assessment Total Assessment is a certain percentage of the fair market value that is determined by local assessors to be the total taxable value of land and additions on the property. | Land | Improvement |
|---|---|---|---|---|
| 2025 | $2,428 | $156,270 | $38,047 | $118,223 |
| 2024 | $2,428 | $153,206 | $37,301 | $115,905 |
| 2023 | $1,920 | $150,202 | $36,570 | $113,632 |
| 2022 | $1,895 | $147,257 | $35,853 | $111,404 |
| 2021 | $1,867 | $144,370 | $35,150 | $109,220 |
| 2020 | $1,848 | $142,890 | $34,790 | $108,100 |
| 2019 | $1,801 | $140,088 | $34,108 | $105,980 |
| 2018 | $1,803 | $137,341 | $33,439 | $103,902 |
| 2017 | $1,767 | $134,648 | $32,783 | $101,865 |
| 2016 | $1,716 | $132,008 | $32,140 | $99,868 |
| 2015 | $1,677 | $130,025 | $31,657 | $98,368 |
| 2014 | $1,663 | $127,478 | $31,037 | $96,441 |
Source: Public Records
Map
Nearby Homes
- 8937 Palmetto Ave
- Newbridge Plan at Summit Park - Paloma
- Niagra Plan at Summit Park - Paloma
- 3544 E Aurora Dr
- 3528 E Aurora Dr
- Ballard Plan at Summit Park - Aurora
- Barbara Plan at Summit Park - Aurora
- Bastian Plan at Summit Park - Aurora
- 17379 Orchid Dr
- 17232 Ceres Ave
- 8870 Blanchard Ave
- 9105 Tamarind Ave
- 17391 Athol St
- 8939 Mango Ave Unit F
- 17626 Orange Ct
- 8998 Mango Ave Unit H
- 8866 Emerald Ave
- 17425 Arrow Blvd Unit 8
- 9020 Newport Ave Unit 17
- 9010 Newport Ave
- 17408 Merrill Ave
- 17378 Merrill Ave
- 17366 Merrill Ave
- 17397 Merrill Ave
- 17387 Merrill Ave
- 8912 Encina Ave
- 17377 Merrill Ave
- 8920 Encina Ave
- 17440 Merrill Ave
- 17365 Merrill Ave
- 8930 Encina Ave
- 17355 Merrill Ave
- 8911 Encina Ave
- 8938 Encina Ave
- 8919 Encina Ave
- 17456 Merrill Ave
- 17417 Anastasia Ave
- 8929 Encina Ave
- 17345 Merrill Ave
- 8946 Encina Ave