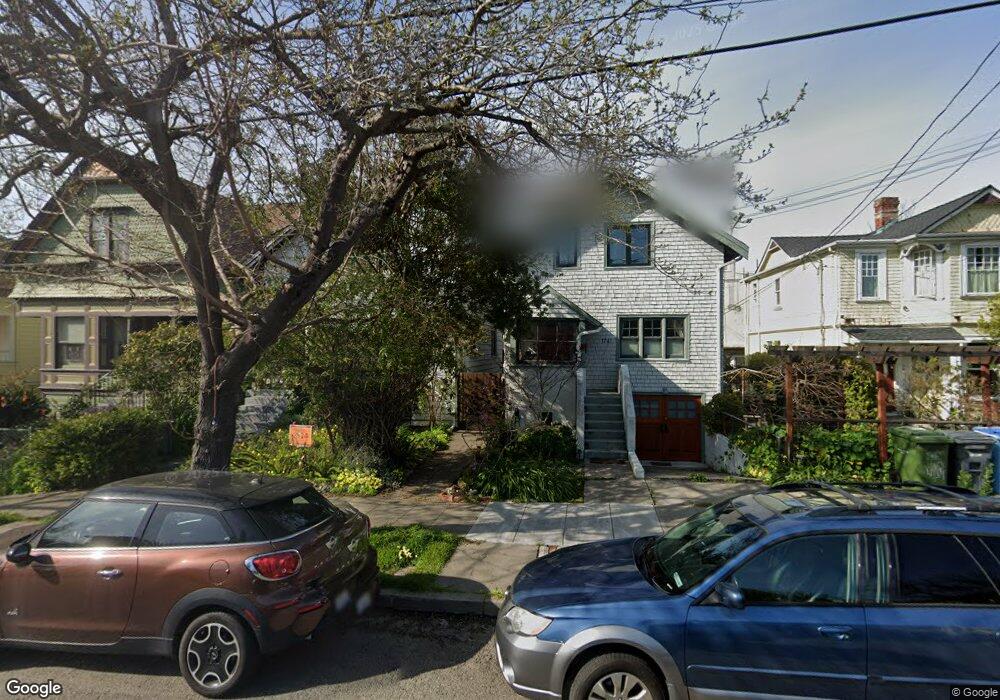
1739 Blake St Berkeley, CA 94703
South Berkeley NeighborhoodEstimated Value: $1,205,000 - $1,412,000
3
Beds
1
Bath
1,321
Sq Ft
$996/Sq Ft
Est. Value
About This Home
This home is located at 1739 Blake St, Berkeley, CA 94703 and is currently estimated at $1,315,760, approximately $996 per square foot. 1739 Blake St is a home located in Alameda County with nearby schools including Malcolm X Elementary School, Emerson Elementary School, and John Muir Elementary School.
Ownership History
Date
Name
Owned For
Owner Type
Purchase Details
Closed on
May 28, 2021
Sold by
Weber Stover Justin P and Weber Stover Alison
Bought by
Weber Stover Alison Noel and Weber Stover Justin
Current Estimated Value
Purchase Details
Closed on
May 6, 2008
Sold by
Nivins Vera L
Bought by
Weber Stover Justin P and Weber Stover Alison N
Home Financials for this Owner
Home Financials are based on the most recent Mortgage that was taken out on this home.
Original Mortgage
$417,000
Outstanding Balance
$262,977
Interest Rate
5.8%
Mortgage Type
Purchase Money Mortgage
Estimated Equity
$1,052,783
Create a Home Valuation Report for This Property
The Home Valuation Report is an in-depth analysis detailing your home's value as well as a comparison with similar homes in the area
Home Values in the Area
Average Home Value in this Area
Purchase History
| Date | Buyer | Sale Price | Title Company |
|---|---|---|---|
| Weber Stover Alison Noel | -- | None Available | |
| Weber Stover Alison Noel | -- | None Available | |
| Weber Stover Justin P | $444,000 | Financial Title Company |
Source: Public Records
Mortgage History
| Date | Status | Borrower | Loan Amount |
|---|---|---|---|
| Open | Weber Stover Justin P | $417,000 |
Source: Public Records
Tax History Compared to Growth
Tax History
| Year | Tax Paid | Tax Assessment Tax Assessment Total Assessment is a certain percentage of the fair market value that is determined by local assessors to be the total taxable value of land and additions on the property. | Land | Improvement |
|---|---|---|---|---|
| 2025 | $9,721 | $600,572 | $174,909 | $432,663 |
| 2024 | $9,721 | $588,660 | $171,480 | $424,180 |
| 2023 | $9,513 | $583,985 | $168,119 | $415,866 |
| 2022 | $9,331 | $565,536 | $164,823 | $407,713 |
| 2021 | $9,343 | $554,313 | $161,592 | $399,721 |
| 2020 | $8,820 | $555,558 | $159,935 | $395,623 |
| 2019 | $8,221 | $522,670 | $156,801 | $365,869 |
| 2018 | $7,951 | $512,424 | $153,727 | $358,697 |
| 2017 | $7,657 | $502,378 | $150,713 | $351,665 |
| 2016 | $7,394 | $492,528 | $147,758 | $344,770 |
| 2015 | $7,293 | $485,133 | $145,540 | $339,593 |
| 2014 | $7,236 | $475,634 | $142,690 | $332,944 |
Source: Public Records
Map
Nearby Homes
- 2533 Grant St
- 1726 Parker St Unit 2
- 1726 Parker St Unit 1
- 1711 Carleton St
- 1819 Carleton St
- 1901 Parker St Unit 3
- 1612 Parker St
- 2701 Grant St
- 1524 Blake St
- 1606 Derby St
- 1516 Blake St
- 1516 Blake St Unit A
- 1540 Stuart St
- 1431 Dwight Way
- 2437 Acton St
- 2750 Sacramento St
- 1450 Ward St
- 2758 Sacramento St
- 2774 Sacramento St
- 2218 -2222 Grant St
- 1741 Blake St
- 1737 Blake St
- 31133115 Ellis St
- 1735 Blake St
- 1733 Blake St
- 1743 Blake St
- 2510 Grant St
- 1731 Blake St
- 2508 Grant St
- 1729 Blake St
- 2504 Grant St
- 1736 Dwight Way
- 1732 Dwight Way
- 1730 Dwight Way
- 2520 Grant St
- 1725 Blake St
- 2500 Grant St
- 1723 Blake St
- 1742 Blake St Unit 2
- 1742 Blake St Unit 4
