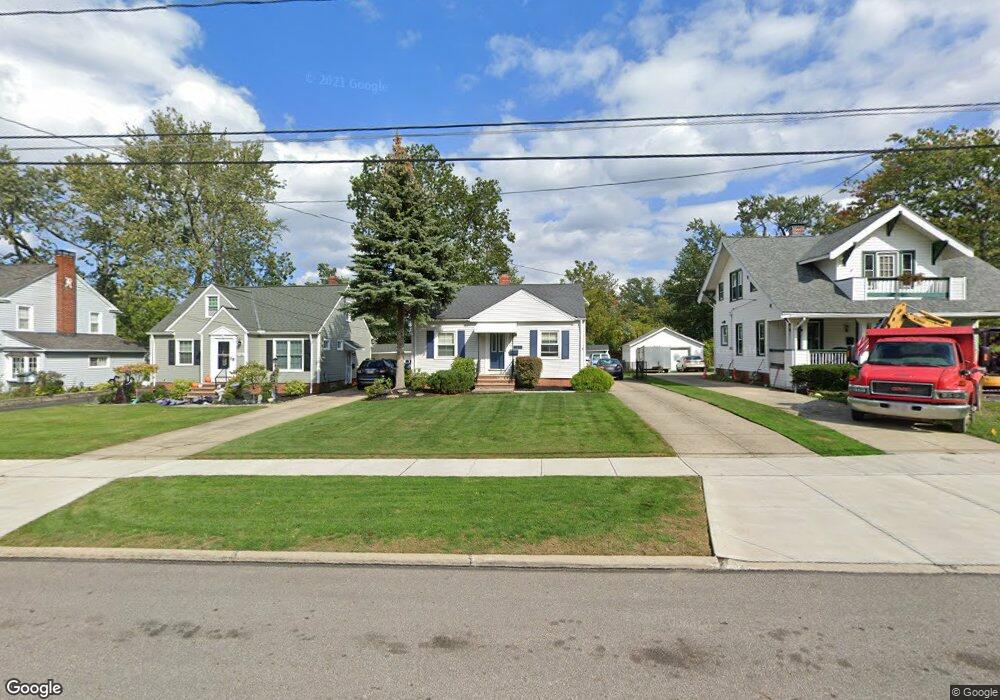
1739 Maple St Wickliffe, OH 44092
Estimated Value: $149,942 - $185,000
2
Beds
1
Bath
761
Sq Ft
$215/Sq Ft
Est. Value
About This Home
This home is located at 1739 Maple St, Wickliffe, OH 44092 and is currently estimated at $163,986, approximately $215 per square foot. 1739 Maple St is a home located in Lake County with nearby schools including Wickliffe Elementary School, Wickliffe Middle School, and Wickliffe High School.
Ownership History
Date
Name
Owned For
Owner Type
Purchase Details
Closed on
Dec 22, 2017
Sold by
Finkler Howard J
Bought by
Finkler Brian D
Current Estimated Value
Purchase Details
Closed on
Jun 5, 2006
Sold by
Shaniuk Diana R
Bought by
Finkler Howard J and Finkler Lana L
Home Financials for this Owner
Home Financials are based on the most recent Mortgage that was taken out on this home.
Original Mortgage
$97,800
Interest Rate
6.68%
Mortgage Type
Credit Line Revolving
Purchase Details
Closed on
Aug 8, 2002
Sold by
Bodo Billie J and Bodo Billie J
Bought by
Shaniuk Diana R
Home Financials for this Owner
Home Financials are based on the most recent Mortgage that was taken out on this home.
Original Mortgage
$109,150
Interest Rate
6.62%
Mortgage Type
FHA
Purchase Details
Closed on
Aug 27, 1990
Bought by
Bodo Billie J
Create a Home Valuation Report for This Property
The Home Valuation Report is an in-depth analysis detailing your home's value as well as a comparison with similar homes in the area
Home Values in the Area
Average Home Value in this Area
Purchase History
| Date | Buyer | Sale Price | Title Company |
|---|---|---|---|
| Finkler Brian D | -- | None Available | |
| Finkler Howard J | -- | None Available | |
| Finkler Howard J | $122,300 | Insured Title | |
| Shaniuk Diana R | $110,900 | Real Estate Title | |
| Bodo Billie J | $73,000 | -- |
Source: Public Records
Mortgage History
| Date | Status | Borrower | Loan Amount |
|---|---|---|---|
| Closed | Finkler Howard J | $97,800 | |
| Previous Owner | Shaniuk Diana R | $109,150 |
Source: Public Records
Tax History
| Year | Tax Paid | Tax Assessment Tax Assessment Total Assessment is a certain percentage of the fair market value that is determined by local assessors to be the total taxable value of land and additions on the property. | Land | Improvement |
|---|---|---|---|---|
| 2025 | -- | $52,940 | $16,120 | $36,820 |
| 2024 | -- | $52,940 | $16,120 | $36,820 |
| 2023 | $4,473 | $36,370 | $13,630 | $22,740 |
| 2022 | $1,992 | $36,370 | $13,630 | $22,740 |
| 2021 | $1,998 | $36,370 | $13,630 | $22,740 |
| 2020 | $2,526 | $29,800 | $11,170 | $18,630 |
| 2019 | $2,525 | $29,800 | $11,170 | $18,630 |
| 2018 | $2,183 | $31,390 | $12,240 | $19,150 |
| 2017 | $1,605 | $31,390 | $12,240 | $19,150 |
| 2016 | $1,597 | $31,390 | $12,240 | $19,150 |
| 2015 | $1,559 | $31,390 | $12,240 | $19,150 |
| 2014 | $1,373 | $31,390 | $12,240 | $19,150 |
| 2013 | $1,373 | $31,390 | $12,240 | $19,150 |
Source: Public Records
Map
Nearby Homes
- 28900 Euclid Ave
- 0 Green Ridge Dr
- 1835 Robindale St
- 29315 Nehls Park Dr
- 1540 E 298th St
- 1526 E 298th St
- 2715 Cabin Dr
- 29902 Euclid Ave Unit B7
- 1719 E 300th St
- 30200 Ridge Rd
- 29136 Norman Ave
- 953 Bryn Mawr Ave
- 1544 Ridgewick Dr
- 1842 Eldon Dr
- 1670 Hillandale Dr
- 730 Hemlock Dr
- 940 Talmadge Ave
- 815 E 272nd St
- 29800 Robert St
- 670 Hemlock Dr
Your Personal Tour Guide
Ask me questions while you tour the home.