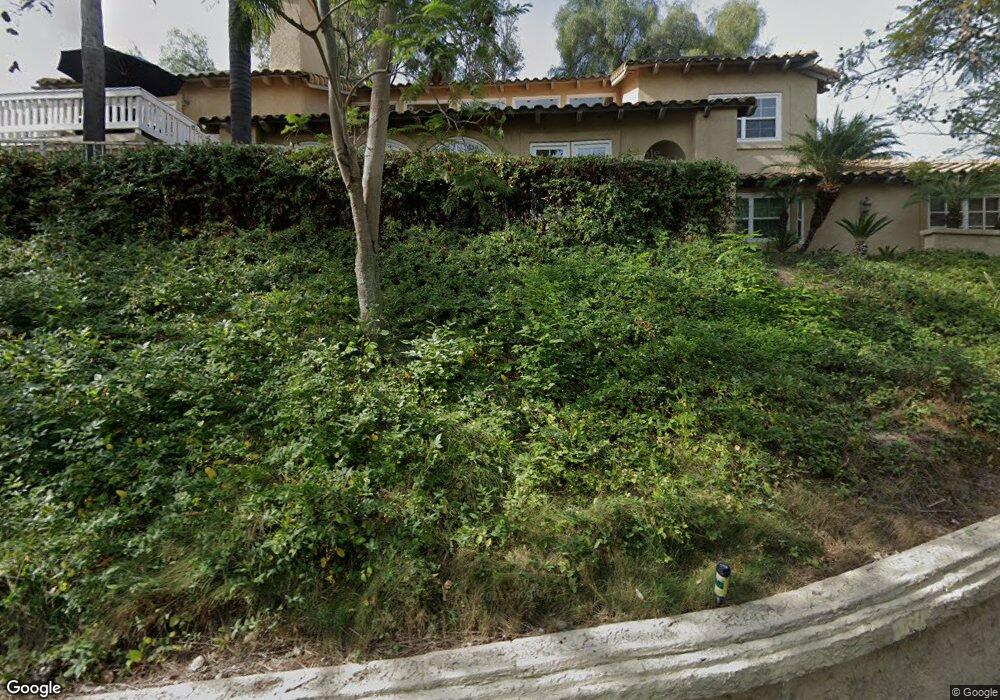
1739 Pueblo Crest Ln La Habra Heights, CA 90631
Estimated Value: $1,623,000 - $2,189,000
3
Beds
4
Baths
3,772
Sq Ft
$503/Sq Ft
Est. Value
About This Home
This home is located at 1739 Pueblo Crest Ln, La Habra Heights, CA 90631 and is currently estimated at $1,897,571, approximately $503 per square foot. 1739 Pueblo Crest Ln is a home located in Los Angeles County with nearby schools including El Portal Elementary School, Rancho-Starbuck Intermediate School, and Sonora High School.
Ownership History
Date
Name
Owned For
Owner Type
Purchase Details
Closed on
Jun 7, 2012
Sold by
Lee Norman and Lee Jeanne
Bought by
Bennett Donald Allen and Bennett Heather Joy
Current Estimated Value
Home Financials for this Owner
Home Financials are based on the most recent Mortgage that was taken out on this home.
Original Mortgage
$495,000
Interest Rate
3.62%
Mortgage Type
New Conventional
Purchase Details
Closed on
Aug 26, 1998
Sold by
Brentwood Bank Of California
Bought by
Lee Norman and Lee Jeanne
Home Financials for this Owner
Home Financials are based on the most recent Mortgage that was taken out on this home.
Original Mortgage
$480,000
Interest Rate
4.87%
Purchase Details
Closed on
Jul 15, 1998
Sold by
Watanabe Masamitsu and Watanabe Trang
Bought by
Brentwood Bank Of California
Home Financials for this Owner
Home Financials are based on the most recent Mortgage that was taken out on this home.
Original Mortgage
$480,000
Interest Rate
4.87%
Create a Home Valuation Report for This Property
The Home Valuation Report is an in-depth analysis detailing your home's value as well as a comparison with similar homes in the area
Home Values in the Area
Average Home Value in this Area
Purchase History
| Date | Buyer | Sale Price | Title Company |
|---|---|---|---|
| Bennett Donald Allen | $1,025,000 | Lawyers Title | |
| Lee Norman | $610,000 | Chicago Title Co | |
| Brentwood Bank Of California | $688,545 | American Title Co |
Source: Public Records
Mortgage History
| Date | Status | Borrower | Loan Amount |
|---|---|---|---|
| Previous Owner | Bennett Donald Allen | $495,000 | |
| Previous Owner | Lee Norman | $480,000 |
Source: Public Records
Tax History Compared to Growth
Tax History
| Year | Tax Paid | Tax Assessment Tax Assessment Total Assessment is a certain percentage of the fair market value that is determined by local assessors to be the total taxable value of land and additions on the property. | Land | Improvement |
|---|---|---|---|---|
| 2025 | $14,673 | $1,262,203 | $615,709 | $646,494 |
| 2024 | $14,673 | $1,237,455 | $603,637 | $633,818 |
| 2023 | $14,340 | $1,213,192 | $591,801 | $621,391 |
| 2022 | $14,195 | $1,189,405 | $580,198 | $609,207 |
| 2021 | $13,882 | $1,166,084 | $568,822 | $597,262 |
| 2019 | $13,505 | $1,131,499 | $551,951 | $579,548 |
| 2018 | $25,696 | $1,109,314 | $541,129 | $568,185 |
| 2016 | $24,962 | $1,066,240 | $520,117 | $546,123 |
| 2015 | $11,620 | $1,050,225 | $512,305 | $537,920 |
| 2014 | $11,603 | $1,029,653 | $502,270 | $527,383 |
Source: Public Records
Map
Nearby Homes
- 1620 El Travesia Dr
- 1230 Sunbird Ave
- 506 Dorothea Rd
- 1421 Launer Dr
- 1320 Marlei Rd
- 1020 La Serna Ave
- 1944 Chandos Ln
- 0 Ardsheal Dr Unit PW23063710
- 927 E Avocado Crest Rd
- 161 W Hidden Ln
- 220 Olinda Ave
- 918 Dorothea Rd
- 105 Reposado Dr
- 9915 Corella Ave
- 1445 Darlene Dr
- 16875 Sausalito Dr
- 950 N Walnut St
- 320 -330 Monte Vista
- 9422 Canfield Dr
- 1100 N Euclid St
- 1739 Pueblo Crest Ln
- 1737 Pueblo Crest Ln
- 1727 Pueblo Crest Ln
- 376 E Avocado Crest Rd
- 378 E Avocado Crest Rd
- 1717 Pueblo Crest Ln
- 372 E Avocado Crest Rd
- 550 Lamat Rd
- 444 E Avocado Crest Rd
- 1757 Pueblo Crest Ln
- 380 E Avocado Crest Rd
- 351 Skycrest Rd
- 335 Skycrest Rd
- 1756 Pueblo Crest Ln
- 339 Skycrest Rd
- 1743 Pueblo Crest Ln
- 1362 Citrus St
- 1707 Pueblo Crest Ln
- 424 E Avocado Crest Rd
- 548 Lamat Rd