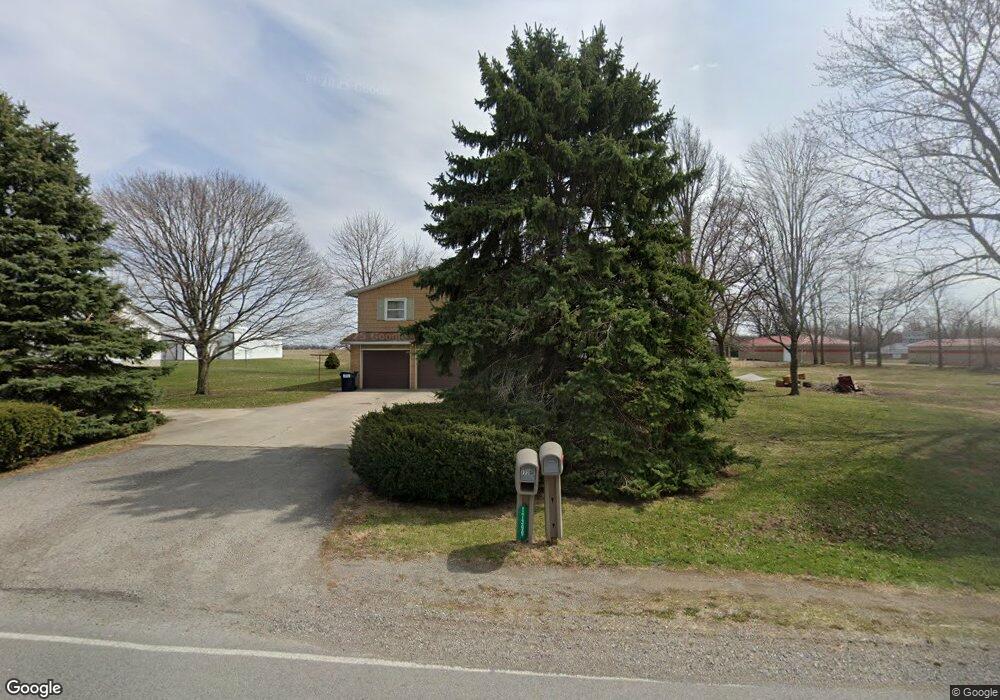
17399 Old State Route 65 Columbus Grove, OH 45830
Estimated Value: $210,000 - $358,000
4
Beds
3
Baths
2,352
Sq Ft
$119/Sq Ft
Est. Value
About This Home
This home is located at 17399 Old State Route 65, Columbus Grove, OH 45830 and is currently estimated at $280,762, approximately $119 per square foot. 17399 Old State Route 65 is a home located in Putnam County with nearby schools including Columbus Grove Elementary School, Columbus Grove Middle School, and Columbus Grove High School.
Ownership History
Date
Name
Owned For
Owner Type
Purchase Details
Closed on
Oct 29, 2020
Sold by
Fisher Kevin and Fisher Sara A
Bought by
Hoskins Joshua D and Hoskins Samantha N
Current Estimated Value
Home Financials for this Owner
Home Financials are based on the most recent Mortgage that was taken out on this home.
Original Mortgage
$141,400
Outstanding Balance
$125,826
Interest Rate
2.8%
Mortgage Type
Future Advance Clause Open End Mortgage
Estimated Equity
$154,936
Purchase Details
Closed on
Sep 29, 2008
Sold by
Kohls Robert F and Kohls Mary J
Bought by
Fisher Kevin and Fisher Sara A
Home Financials for this Owner
Home Financials are based on the most recent Mortgage that was taken out on this home.
Original Mortgage
$103,200
Interest Rate
6.41%
Mortgage Type
New Conventional
Purchase Details
Closed on
Jul 11, 2008
Sold by
Kohls Michael L and Kohls Roberta
Bought by
Kohls Robert F and Kohls Mary J
Create a Home Valuation Report for This Property
The Home Valuation Report is an in-depth analysis detailing your home's value as well as a comparison with similar homes in the area
Home Values in the Area
Average Home Value in this Area
Purchase History
| Date | Buyer | Sale Price | Title Company |
|---|---|---|---|
| Hoskins Joshua D | $140,000 | None Available | |
| Fisher Kevin | $129,000 | None Available | |
| Kohls Robert F | $1,000 | Attorney |
Source: Public Records
Mortgage History
| Date | Status | Borrower | Loan Amount |
|---|---|---|---|
| Open | Hoskins Joshua D | $141,400 | |
| Closed | Fisher Kevin | $103,200 |
Source: Public Records
Tax History Compared to Growth
Tax History
| Year | Tax Paid | Tax Assessment Tax Assessment Total Assessment is a certain percentage of the fair market value that is determined by local assessors to be the total taxable value of land and additions on the property. | Land | Improvement |
|---|---|---|---|---|
| 2024 | $2,167 | $68,660 | $6,820 | $61,840 |
| 2023 | $2,292 | $60,810 | $5,390 | $55,420 |
| 2022 | $2,325 | $60,809 | $5,390 | $55,419 |
| 2021 | $2,153 | $60,810 | $5,390 | $55,420 |
| 2020 | $2,178 | $51,930 | $4,490 | $47,440 |
| 2019 | $1,846 | $52,900 | $5,390 | $47,510 |
| 2018 | $1,848 | $52,900 | $5,390 | $47,510 |
| 2017 | $1,858 | $52,900 | $5,390 | $47,510 |
| 2016 | $1,782 | $51,930 | $4,490 | $47,440 |
| 2015 | $1,792 | $51,930 | $4,490 | $47,440 |
| 2014 | $1,809 | $51,930 | $4,490 | $47,440 |
| 2013 | $1,804 | $51,930 | $4,490 | $47,440 |
Source: Public Records
Map
Nearby Homes
- 209 Willow Bend Dr
- 205 S Broadway St
- 204 S Broadway St
- 308 Delphos Rd
- 11059 Ottawa Rd
- 704 Sherman St
- 208 E Monroe St
- 101 Maplewood Dr
- 17429 Road 5
- 147 Elm St
- 15105 Road 15m
- 00000 Ohio 696
- 000 Ohio 696
- 0000 Ohio 696
- 148 S Water St
- 8160 Columbus Grove-Bluffton Rd
- 370 S Thomas St
- 717 E 2nd St
- 1854 S Agner St
- 740 E Main St
- 17399 Old Sr Unit 65
- 17399 Old Sr
- 17406 Old State Route 65
- 17371 Old State Route 65
- 17380 Old State Route 65
- 415 N Main St
- 17364 Old State Route 65
- 413 N Main St
- 17326 Old State Route 65
- 115 Robinson Ave
- 111 Robinson Ave
- 106 Robinson Ave
- 108 Robinson Ave
- 102 Robinson Ave
- 110 Robinson Ave
- 104 Robinson Ave
- 407 N Main St
- 17286 Old State Route 65
- 112 Robinson Ave
- 404 N Main St