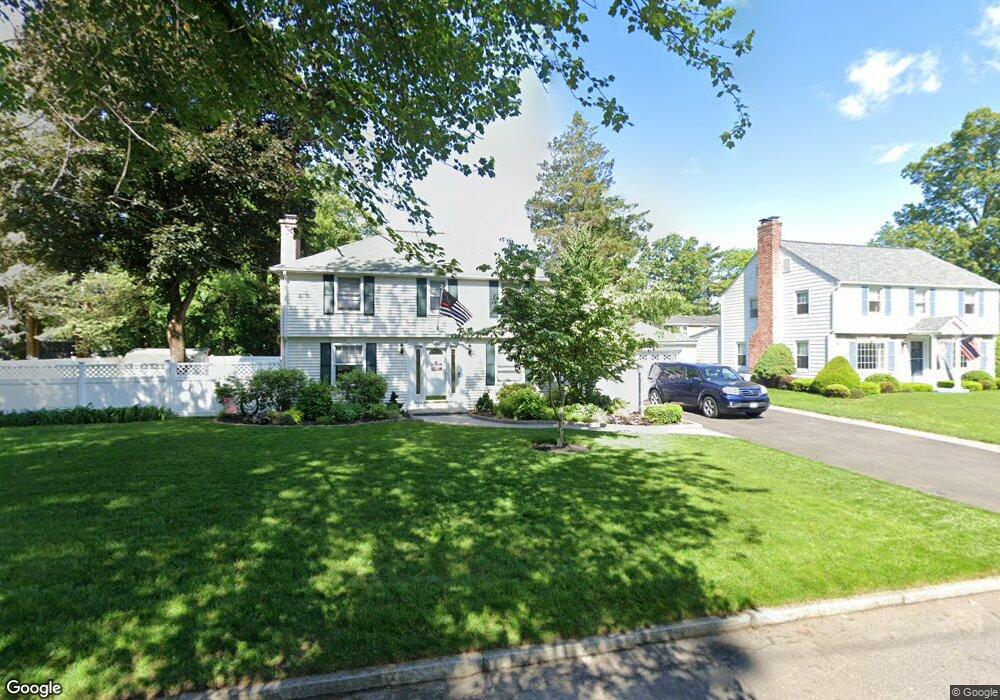
174 Chalmers St Springfield, MA 01118
East Forest Park NeighborhoodEstimated Value: $338,000 - $390,000
3
Beds
2
Baths
1,694
Sq Ft
$217/Sq Ft
Est. Value
About This Home
This home is located at 174 Chalmers St, Springfield, MA 01118 and is currently estimated at $368,276, approximately $217 per square foot. 174 Chalmers St is a home located in Hampden County with nearby schools including Frederick Harris Elementary School, M Marcus Kiley Middle, and Springfield High School of Science and Technology.
Ownership History
Date
Name
Owned For
Owner Type
Purchase Details
Closed on
Oct 15, 1992
Sold by
Morse David J and Shepherd Susan C
Bought by
Martin Michael E and Martin Ann M
Current Estimated Value
Home Financials for this Owner
Home Financials are based on the most recent Mortgage that was taken out on this home.
Original Mortgage
$90,000
Interest Rate
7.93%
Mortgage Type
Purchase Money Mortgage
Create a Home Valuation Report for This Property
The Home Valuation Report is an in-depth analysis detailing your home's value as well as a comparison with similar homes in the area
Home Values in the Area
Average Home Value in this Area
Purchase History
| Date | Buyer | Sale Price | Title Company |
|---|---|---|---|
| Martin Michael E | $117,500 | -- |
Source: Public Records
Mortgage History
| Date | Status | Borrower | Loan Amount |
|---|---|---|---|
| Open | Martin Michael E | $15,000 | |
| Closed | Martin Michael E | $90,000 |
Source: Public Records
Tax History
| Year | Tax Paid | Tax Assessment Tax Assessment Total Assessment is a certain percentage of the fair market value that is determined by local assessors to be the total taxable value of land and additions on the property. | Land | Improvement |
|---|---|---|---|---|
| 2025 | $5,676 | $362,000 | $39,400 | $322,600 |
| 2024 | $5,271 | $328,200 | $39,400 | $288,800 |
| 2023 | $5,236 | $307,100 | $40,900 | $266,200 |
| 2022 | $5,371 | $285,400 | $40,900 | $244,500 |
| 2021 | $4,942 | $261,500 | $37,200 | $224,300 |
| 2020 | $4,650 | $238,100 | $37,200 | $200,900 |
| 2019 | $4,253 | $216,100 | $37,200 | $178,900 |
| 2018 | $4,320 | $219,500 | $37,200 | $182,300 |
| 2017 | $4,205 | $213,900 | $37,200 | $176,700 |
| 2016 | $4,015 | $204,200 | $37,200 | $167,000 |
| 2015 | $3,973 | $202,000 | $37,200 | $164,800 |
Source: Public Records
Map
Nearby Homes
- 509 Plumtree Rd
- 37 Chesterfield Ave
- 75 Gillette Cir
- 101 Regal St
- 7 Ashbrook St
- 47 Hartford Terrace
- 647 Plumtree Rd
- 384 Abbott St
- 79 Roosevelt Ave
- 19 Manor Ct Unit 19
- 55 Allen St
- 134 Eddywood St
- 125 Manor Ct Unit 125
- 170 Plumtree Rd
- 1088 Sumner Ave
- 29 Eddywood St
- 54 S Shore Dr
- 119 Powell Ave
- 13 Bither St
- 49 Corcoran Blvd
Your Personal Tour Guide
Ask me questions while you tour the home.