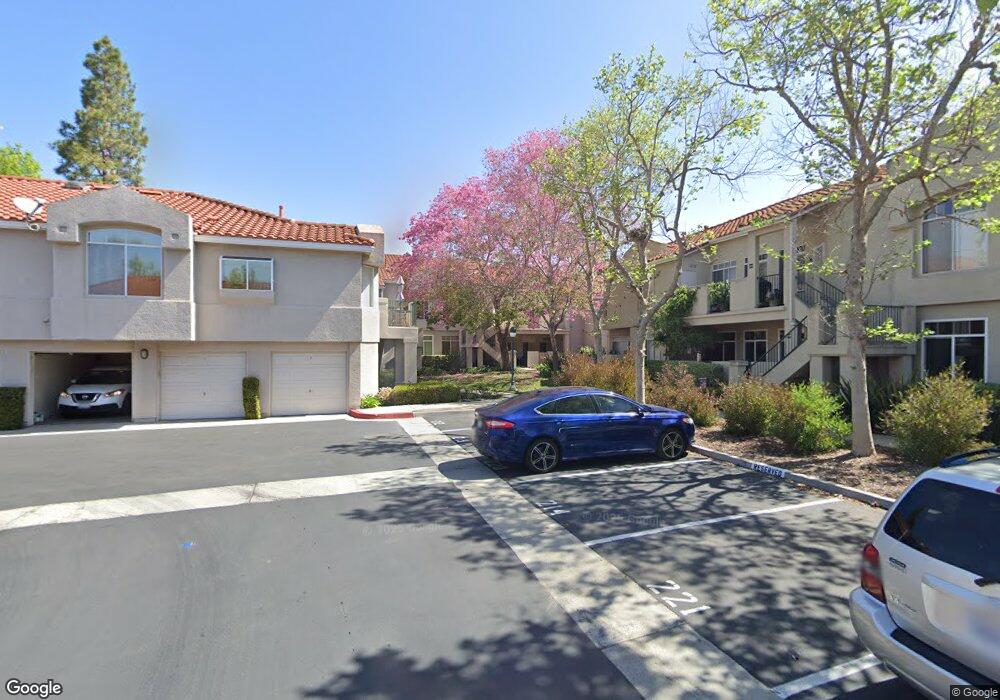
174 Cinnamon Teal Unit 148 Aliso Viejo, CA 92656
Estimated Value: $611,042 - $710,000
2
Beds
2
Baths
989
Sq Ft
$687/Sq Ft
Est. Value
About This Home
This home is located at 174 Cinnamon Teal Unit 148, Aliso Viejo, CA 92656 and is currently estimated at $679,011, approximately $686 per square foot. 174 Cinnamon Teal Unit 148 is a home located in Orange County with nearby schools including Top Of The World Elementary School, Thurston Middle School, and Laguna Beach High School.
Ownership History
Date
Name
Owned For
Owner Type
Purchase Details
Closed on
Sep 25, 2023
Sold by
Jacobs Robert M
Bought by
Robert Jacobs Trust and Jacobs
Current Estimated Value
Purchase Details
Closed on
Mar 19, 2001
Sold by
Miller Stephen C
Bought by
Jacobs Robert M
Home Financials for this Owner
Home Financials are based on the most recent Mortgage that was taken out on this home.
Original Mortgage
$159,200
Interest Rate
6.98%
Purchase Details
Closed on
Dec 27, 1994
Sold by
Rager Kenneth A
Bought by
Miller Stephen C
Home Financials for this Owner
Home Financials are based on the most recent Mortgage that was taken out on this home.
Original Mortgage
$119,340
Interest Rate
9.2%
Mortgage Type
Assumption
Create a Home Valuation Report for This Property
The Home Valuation Report is an in-depth analysis detailing your home's value as well as a comparison with similar homes in the area
Home Values in the Area
Average Home Value in this Area
Purchase History
| Date | Buyer | Sale Price | Title Company |
|---|---|---|---|
| Robert Jacobs Trust | -- | None Listed On Document | |
| Jacobs Robert M | $200,000 | Equity Title Company | |
| Miller Stephen C | $117,000 | -- |
Source: Public Records
Mortgage History
| Date | Status | Borrower | Loan Amount |
|---|---|---|---|
| Previous Owner | Jacobs Robert M | $159,200 | |
| Previous Owner | Miller Stephen C | $119,340 | |
| Closed | Jacobs Robert M | $29,850 |
Source: Public Records
Tax History Compared to Growth
Tax History
| Year | Tax Paid | Tax Assessment Tax Assessment Total Assessment is a certain percentage of the fair market value that is determined by local assessors to be the total taxable value of land and additions on the property. | Land | Improvement |
|---|---|---|---|---|
| 2025 | $2,944 | $301,208 | $169,209 | $131,999 |
| 2024 | $2,944 | $295,302 | $165,891 | $129,411 |
| 2023 | $2,876 | $289,512 | $162,638 | $126,874 |
| 2022 | $2,821 | $283,836 | $159,449 | $124,387 |
| 2021 | $2,765 | $278,271 | $156,322 | $121,949 |
| 2020 | $2,736 | $275,418 | $154,719 | $120,699 |
| 2019 | $2,688 | $270,018 | $151,685 | $118,333 |
| 2018 | $2,635 | $264,724 | $148,711 | $116,013 |
| 2017 | $2,581 | $259,534 | $145,795 | $113,739 |
| 2016 | $2,521 | $254,446 | $142,937 | $111,509 |
| 2015 | $2,620 | $250,624 | $140,789 | $109,835 |
| 2014 | $2,563 | $245,715 | $138,031 | $107,684 |
Source: Public Records
Map
Nearby Homes
- 126 Cinnamon Teal
- 5543 Avenida Sosiega W Unit A
- 163 Night Heron Ln
- 90 Night Heron Ln
- 3271 San Amadeo Unit P
- 102 Santa Rosa Ct
- 65 Waxwing Ln
- 33 Pheasant Ln
- 3296 San Amadeo
- 3253 San Amadeo Unit P
- 403 San Nicholas Ct Unit 403
- 302 San Nicholas Ct
- 3270 San Amadeo Unit B
- 92 Nightingale Dr
- 3277 San Amadeo Unit A
- 3255 San Amadeo Unit B
- 3504 Bahia Blanca W Unit C
- 3300 Via Carrizo Unit A
- 3300 Via Carrizo Unit D
- 3500 Bahia Blanca W Unit 3B
- 172 Cinnamon Teal Unit 155
- 170 Cinnamon Teal
- 176 Cinnamon Teal
- 178 Cinnamon Teal
- 168 Cinnamon Teal Unit 156
- 180 Cinnamon Teal
- 166 Cinnamon Teal
- 182 Cinnamon Teal
- 164 Cinnamon Teal Unit 157
- 214 Cinnamon Teal
- 83 Sandpiper Ln
- 184 Cinnamon Teal Unit 152
- 212 Cinnamon Teal
- 81 Sandpiper Ln Unit 271
- 162 Cinnamon Teal Unit 151
- 85 Sandpiper Ln
- 154 Cinnamon Teal
- 79 Sandpiper Ln
- 216 Cinnamon Teal Unit 219
- 186 Cinnamon Teal