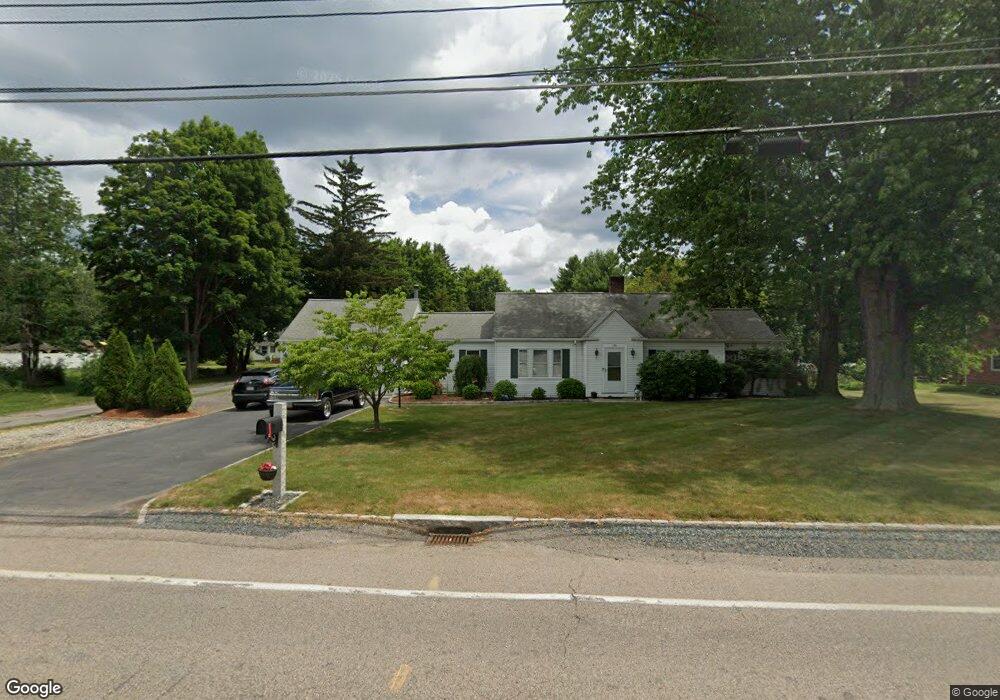
174 East St Foxboro, MA 02035
Estimated Value: $539,000 - $665,945
3
Beds
3
Baths
1,428
Sq Ft
$432/Sq Ft
Est. Value
About This Home
This home is located at 174 East St, Foxboro, MA 02035 and is currently estimated at $616,986, approximately $432 per square foot. 174 East St is a home located in Norfolk County with nearby schools including Foxborough High School, St Mary's Catholic School, and Hands-On-Montessori School.
Ownership History
Date
Name
Owned For
Owner Type
Purchase Details
Closed on
Jun 30, 2014
Sold by
Hunt Catherine M
Bought by
Hunt Kyle and Heinricher Cori
Current Estimated Value
Home Financials for this Owner
Home Financials are based on the most recent Mortgage that was taken out on this home.
Original Mortgage
$280,612
Outstanding Balance
$213,983
Interest Rate
4.19%
Mortgage Type
New Conventional
Estimated Equity
$403,003
Purchase Details
Closed on
Apr 15, 1992
Sold by
Costello John P and Costello Lauren B
Bought by
Hunt Gregory R and Hunt Catherine M
Home Financials for this Owner
Home Financials are based on the most recent Mortgage that was taken out on this home.
Original Mortgage
$130,500
Interest Rate
8.75%
Mortgage Type
Purchase Money Mortgage
Create a Home Valuation Report for This Property
The Home Valuation Report is an in-depth analysis detailing your home's value as well as a comparison with similar homes in the area
Home Values in the Area
Average Home Value in this Area
Purchase History
| Date | Buyer | Sale Price | Title Company |
|---|---|---|---|
| Hunt Kyle | $275,000 | -- | |
| Hunt Gregory R | $145,000 | -- |
Source: Public Records
Mortgage History
| Date | Status | Borrower | Loan Amount |
|---|---|---|---|
| Open | Hunt Kyle | $280,612 | |
| Previous Owner | Hunt Gregory R | $123,700 | |
| Previous Owner | Hunt Gregory R | $125,600 | |
| Previous Owner | Hunt Gregory R | $130,500 | |
| Previous Owner | Hunt Gregory R | $15,000 |
Source: Public Records
Tax History Compared to Growth
Tax History
| Year | Tax Paid | Tax Assessment Tax Assessment Total Assessment is a certain percentage of the fair market value that is determined by local assessors to be the total taxable value of land and additions on the property. | Land | Improvement |
|---|---|---|---|---|
| 2025 | $6,610 | $500,000 | $244,800 | $255,200 |
| 2024 | $6,837 | $506,100 | $262,300 | $243,800 |
| 2023 | $6,406 | $450,800 | $250,300 | $200,500 |
| 2022 | $6,254 | $430,700 | $225,400 | $205,300 |
| 2021 | $5,936 | $402,700 | $214,500 | $188,200 |
| 2020 | $5,658 | $388,300 | $214,500 | $173,800 |
| 2019 | $5,621 | $382,400 | $215,000 | $167,400 |
| 2018 | $5,328 | $365,700 | $204,700 | $161,000 |
| 2017 | $5,258 | $349,600 | $201,400 | $148,200 |
| 2016 | $5,123 | $345,700 | $194,300 | $151,400 |
| 2015 | $4,578 | $301,400 | $146,800 | $154,600 |
| 2014 | $4,566 | $304,600 | $146,800 | $157,800 |
Source: Public Records
Map
Nearby Homes
- 1 Revere Dr
- 7 Revere Dr
- 12 Community Way
- 35 Independence Dr Unit 35
- 261 East St
- 9 Independence Dr Unit 9
- 67 Morse St
- 132 Cannon Forge Dr
- 5 Lauren Ln
- 170 Cannon Forge Dr
- 2 Red Fox Run
- 25 Winter St
- 55-57 Pine Needle Ln
- 89 Oak St
- 260 Massapoag Ave
- 619 N Main St
- 3 Wampanoag Rd
- 3 Cushing Ln
- Lot One Old Wolomolopoag St
- Lot Two Old Wolomolopoag St