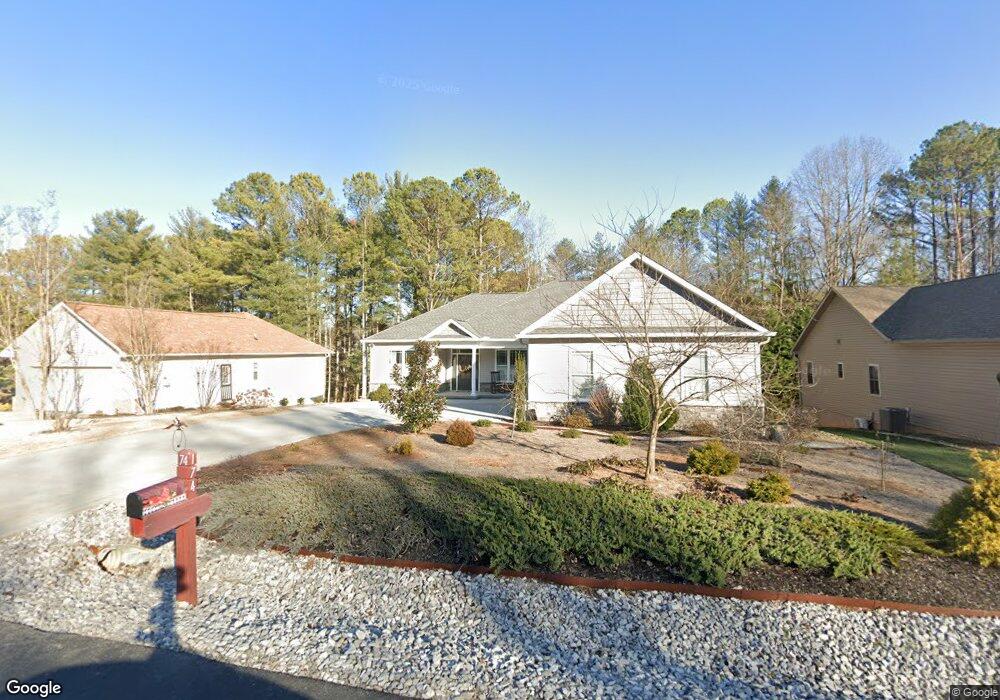
174 Inagehi Way Loudon, TN 37774
Tellico Village NeighborhoodEstimated Value: $605,489 - $754,000
3
Beds
3
Baths
2,340
Sq Ft
$292/Sq Ft
Est. Value
About This Home
This home is located at 174 Inagehi Way, Loudon, TN 37774 and is currently estimated at $683,372, approximately $292 per square foot. 174 Inagehi Way is a home with nearby schools including Loudon High School.
Ownership History
Date
Name
Owned For
Owner Type
Purchase Details
Closed on
Sep 8, 2021
Sold by
Vega Olivia and Vega George
Bought by
Brophy Stephen C and Brophy Nancy A
Current Estimated Value
Purchase Details
Closed on
Apr 3, 2020
Sold by
Tv Holdings Llc
Bought by
Whipple William R and Whipple Kathryn J
Purchase Details
Closed on
Mar 6, 2020
Sold by
Teboul Richard and Shapiro Teboul Teresa
Bought by
Tv Holdings Llc
Purchase Details
Closed on
Jul 16, 2005
Sold by
Natl Recreational Prop Of
Bought by
Richard Reboul
Purchase Details
Closed on
Mar 2, 2005
Sold by
Albert Black
Bought by
National Recreational
Purchase Details
Closed on
Dec 19, 1994
Sold by
Cooper Communities
Bought by
Black and Elsie
Purchase Details
Closed on
Dec 12, 1994
Bought by
Black Albert and Black Elsie L
Purchase Details
Closed on
Oct 24, 1992
Bought by
Cooper Communities
Purchase Details
Closed on
Oct 14, 1992
Bought by
Everett Robert W and Everett Susan P
Purchase Details
Closed on
Jun 25, 1991
Bought by
Cooper Communities
Create a Home Valuation Report for This Property
The Home Valuation Report is an in-depth analysis detailing your home's value as well as a comparison with similar homes in the area
Home Values in the Area
Average Home Value in this Area
Purchase History
| Date | Buyer | Sale Price | Title Company |
|---|---|---|---|
| Brophy Stephen C | $45,000 | Tellico Title Services Inc | |
| Whipple William R | $5,800 | Tellico Title Services Inc | |
| Tv Holdings Llc | -- | None Available | |
| Richard Reboul | $39,700 | -- | |
| National Recreational | $5,000 | -- | |
| Black | -- | -- | |
| Black Albert | $10,000 | -- | |
| Cooper Communities | $20,500 | -- | |
| Everett Robert W | $16,500 | -- | |
| Cooper Communities | $20,000 | -- |
Source: Public Records
Tax History Compared to Growth
Tax History
| Year | Tax Paid | Tax Assessment Tax Assessment Total Assessment is a certain percentage of the fair market value that is determined by local assessors to be the total taxable value of land and additions on the property. | Land | Improvement |
|---|---|---|---|---|
| 2025 | $1,619 | $106,600 | $6,250 | $100,350 |
| 2023 | $1,619 | $106,600 | $0 | $0 |
| 2022 | $1,619 | $106,600 | $6,250 | $100,350 |
| 2021 | $1,472 | $106,600 | $6,250 | $100,350 |
| 2020 | $113 | $96,950 | $6,250 | $90,700 |
| 2019 | $113 | $6,250 | $6,250 | $0 |
| 2018 | $0 | $7,500 | $7,500 | $0 |
| 2017 | $135 | $7,500 | $7,500 | $0 |
| 2016 | $209 | $11,250 | $11,250 | $0 |
| 2015 | $209 | $11,250 | $11,250 | $0 |
| 2014 | $209 | $11,250 | $11,250 | $0 |
Source: Public Records
Map
Nearby Homes
- 218 Mialaquo Cir
- 238 Gadusi Way
- 297 Dudala Way
- 313 Gadusi Ln
- 304 Gado Trace
- 208 Mialaquo Cir
- 310 Dudala Way
- 121 Inagehi Way
- 257 Gadusi Way
- 117 Inagehi Way
- 317 Inagehi Ln
- 108 Oostagala Dr
- 123 Gado Way
- 149 Gado Way
- 114 Inagehi Way
- 308 Oostagala Ln
- 268 Dudala Way
- 138 Gado Way
- 341 Oostagala Place
- 348 Dudala Way
- 176 Inagehi Way
- 172 Inagehi Way
- 178 Inagehi Way
- 170 Inagehi Way
- 175 Inagehi Way
- 173 Inagehi Way
- 130 Dudala Way
- 180 Inagehi Way
- 132 Dudala Way
- 168 Inagehi Way
- 179 Inagehi Way
- 134 Dudala Way
- 128 Dudala Way
- 120 Dudala Way
- 166 Inagehi Way
- 167 Inagehi Way
- 166 Inagehi Way
- 236 Mialaquo Cir
- 118 Dudala Way
- 116 Dudala Way