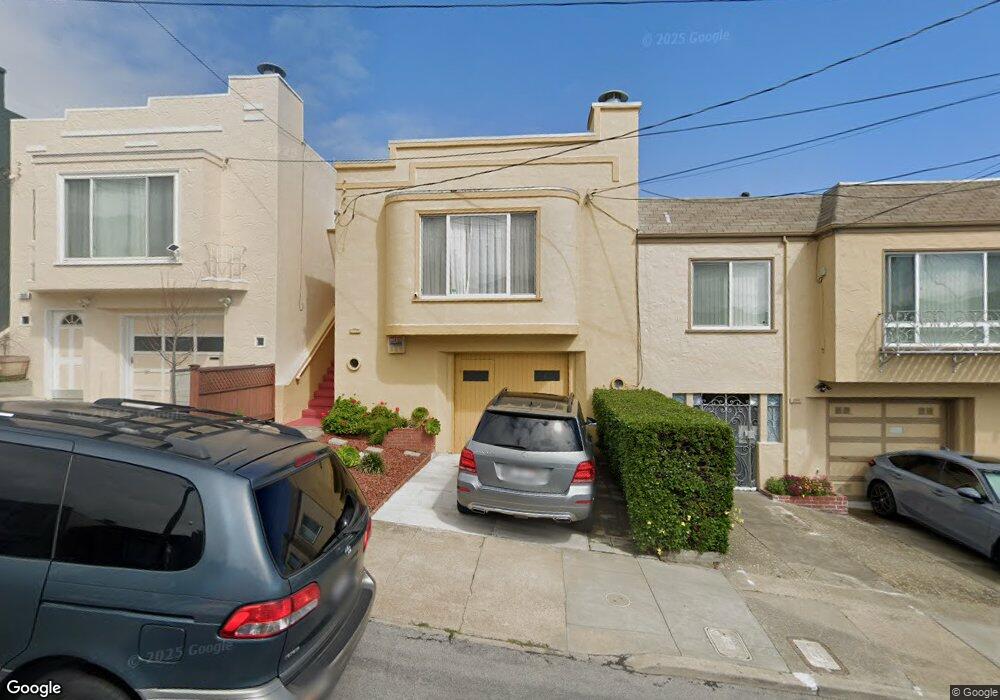
174 Shawnee Ave San Francisco, CA 94112
Outer Mission NeighborhoodEstimated Value: $1,135,000 - $1,212,000
3
Beds
2
Baths
1,792
Sq Ft
$651/Sq Ft
Est. Value
About This Home
This home is located at 174 Shawnee Ave, San Francisco, CA 94112 and is currently estimated at $1,166,174, approximately $650 per square foot. 174 Shawnee Ave is a home located in San Francisco County with nearby schools including Longfellow Elementary School, Denman (James) Middle School, and Leadership High School.
Ownership History
Date
Name
Owned For
Owner Type
Purchase Details
Closed on
Mar 6, 2018
Sold by
Kuang Andy S X and Wu Joan Y Q
Bought by
Kuang Andy S X and Wu Joan Y Q
Current Estimated Value
Purchase Details
Closed on
Jun 26, 2003
Sold by
Kuang Shao X and Wu Yan Q
Bought by
Kuang Shao X and Wu Yan Q
Home Financials for this Owner
Home Financials are based on the most recent Mortgage that was taken out on this home.
Original Mortgage
$200,000
Interest Rate
4.64%
Mortgage Type
Purchase Money Mortgage
Purchase Details
Closed on
Feb 10, 1997
Sold by
94 Mcgovern Katherine and Mcgovern Katherine
Bought by
Kuang Shao Xiong and Wu Yan Qiong
Home Financials for this Owner
Home Financials are based on the most recent Mortgage that was taken out on this home.
Original Mortgage
$170,000
Interest Rate
7.66%
Purchase Details
Closed on
Aug 31, 1994
Sold by
Mcgovern Katherine and Uruburu Katherine
Bought by
Mcgovern Katherine
Purchase Details
Closed on
Jun 13, 1994
Sold by
Mcgovern Patrick
Bought by
Mcgovern Katherine
Create a Home Valuation Report for This Property
The Home Valuation Report is an in-depth analysis detailing your home's value as well as a comparison with similar homes in the area
Home Values in the Area
Average Home Value in this Area
Purchase History
| Date | Buyer | Sale Price | Title Company |
|---|---|---|---|
| Kuang Andy S X | -- | None Available | |
| Kuang Shao X | -- | Stewart Title Company | |
| Kuang Shao Xiong | $230,000 | Fidelity National Title Co | |
| Mcgovern Katherine | -- | -- | |
| Mcgovern Katherine | -- | -- |
Source: Public Records
Mortgage History
| Date | Status | Borrower | Loan Amount |
|---|---|---|---|
| Closed | Kuang Shao X | $200,000 | |
| Closed | Kuang Shao Xiong | $170,000 |
Source: Public Records
Tax History Compared to Growth
Tax History
| Year | Tax Paid | Tax Assessment Tax Assessment Total Assessment is a certain percentage of the fair market value that is determined by local assessors to be the total taxable value of land and additions on the property. | Land | Improvement |
|---|---|---|---|---|
| 2025 | $5,423 | $410,615 | $260,576 | $150,039 |
| 2024 | $5,423 | $402,565 | $255,467 | $147,098 |
| 2023 | $5,332 | $394,673 | $250,458 | $144,215 |
| 2022 | $5,215 | $386,936 | $245,548 | $141,388 |
| 2021 | $5,117 | $379,350 | $240,734 | $138,616 |
| 2020 | $5,156 | $375,462 | $238,266 | $137,196 |
| 2019 | $5,114 | $368,102 | $233,595 | $134,507 |
| 2018 | $4,814 | $360,886 | $229,015 | $131,871 |
| 2017 | $4,458 | $353,811 | $224,525 | $129,286 |
| 2016 | $4,360 | $346,874 | $220,123 | $126,751 |
| 2015 | $4,303 | $341,665 | $216,817 | $124,848 |
| 2014 | $4,190 | $334,973 | $212,570 | $122,403 |
Source: Public Records
Map
Nearby Homes
- 214 Louisburg St
- 115 Ottawa Ave
- 841 Ocean Ave
- 57 Niagara Ave
- 841 Geneva Ave
- 5290 Mission St
- 5254 Mission St
- 5306-5308 Mission St
- 5000 Summit St
- 5020 Mission St Unit 1
- 108 Naglee Ave
- 52 Rolph St
- 21 Hollywood Ct
- 63 Minerva St
- 70 Onondaga Ave
- 4871 Mission St
- 26 Valerton Ct
- 324 Holloway Ave
- 4851 Mission St Unit 1
- 150 France Ave
- 168 Shawnee Ave
- 180 Shawnee Ave
- 186 Shawnee Ave
- 162 Shawnee Ave
- 156 Shawnee Ave
- 192 Shawnee Ave
- 375 Niagara Ave
- 379 Niagara Ave
- 369 Niagara Ave
- 385 Niagara Ave
- 150 Shawnee Ave
- 363 Niagara Ave
- 357 Niagara Ave
- 2401 San Jose Ave
- 146 Shawnee Ave
- 351 Niagara Ave
- 173 Shawnee Ave
- 167 Shawnee Ave
- 179 Shawnee Ave
- 185 Shawnee Ave