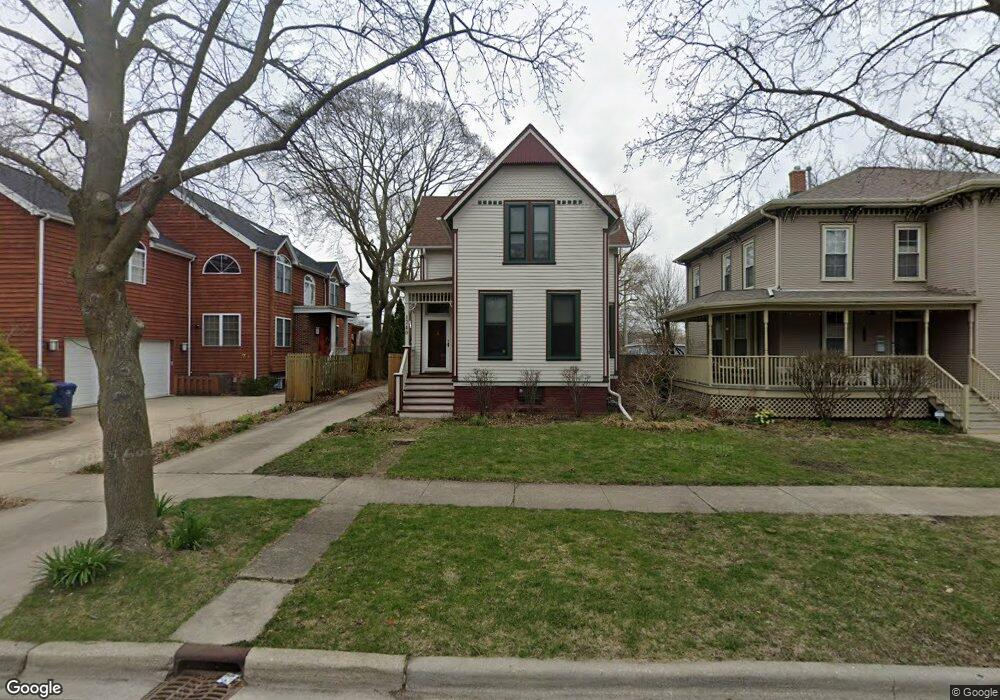
1740 Ashland Ave Evanston, IL 60201
West Evanston NeighborhoodEstimated Value: $508,000 - $733,000
3
Beds
2
Baths
1,835
Sq Ft
$326/Sq Ft
Est. Value
About This Home
This home is located at 1740 Ashland Ave, Evanston, IL 60201 and is currently estimated at $598,454, approximately $326 per square foot. 1740 Ashland Ave is a home located in Cook County with nearby schools including Willard Elementary School, Haven Middle School, and Evanston Township High School.
Ownership History
Date
Name
Owned For
Owner Type
Purchase Details
Closed on
Apr 26, 2002
Sold by
Jenkins Timothy J and Short Jenkins Karla
Bought by
Snurr Randall Q and Dallbauman Liese A
Current Estimated Value
Home Financials for this Owner
Home Financials are based on the most recent Mortgage that was taken out on this home.
Original Mortgage
$360,000
Outstanding Balance
$142,027
Interest Rate
6%
Mortgage Type
Unknown
Estimated Equity
$456,428
Purchase Details
Closed on
Jun 22, 2001
Sold by
Harmon Patrick M and Harmon Leigh B
Bought by
Jenkins Timothy J and Jenkins Karla Short
Home Financials for this Owner
Home Financials are based on the most recent Mortgage that was taken out on this home.
Original Mortgage
$356,000
Interest Rate
6.62%
Purchase Details
Closed on
Apr 28, 1995
Sold by
Joyce Gary A and Joyce Patrice C
Bought by
Harmon Patrick M and Harmon Leigh B
Home Financials for this Owner
Home Financials are based on the most recent Mortgage that was taken out on this home.
Original Mortgage
$196,000
Interest Rate
8.43%
Create a Home Valuation Report for This Property
The Home Valuation Report is an in-depth analysis detailing your home's value as well as a comparison with similar homes in the area
Home Values in the Area
Average Home Value in this Area
Purchase History
| Date | Buyer | Sale Price | Title Company |
|---|---|---|---|
| Snurr Randall Q | $461,000 | Lawyers Title Insurance Corp | |
| Jenkins Timothy J | $445,000 | -- | |
| Harmon Patrick M | $245,000 | Centennial Title Incorporate |
Source: Public Records
Mortgage History
| Date | Status | Borrower | Loan Amount |
|---|---|---|---|
| Open | Snurr Randall Q | $360,000 | |
| Previous Owner | Jenkins Timothy J | $356,000 | |
| Previous Owner | Harmon Patrick M | $196,000 |
Source: Public Records
Tax History Compared to Growth
Tax History
| Year | Tax Paid | Tax Assessment Tax Assessment Total Assessment is a certain percentage of the fair market value that is determined by local assessors to be the total taxable value of land and additions on the property. | Land | Improvement |
|---|---|---|---|---|
| 2024 | $8,155 | $37,000 | $8,748 | $28,252 |
| 2023 | $7,800 | $37,000 | $8,748 | $28,252 |
| 2022 | $7,800 | $37,000 | $8,748 | $28,252 |
| 2021 | $7,322 | $30,923 | $8,019 | $22,904 |
| 2020 | $7,284 | $30,923 | $8,019 | $22,904 |
| 2019 | $7,319 | $34,667 | $8,019 | $26,648 |
| 2018 | $7,035 | $29,114 | $6,561 | $22,553 |
| 2017 | $6,868 | $29,114 | $6,561 | $22,553 |
| 2016 | $6,736 | $29,114 | $6,561 | $22,553 |
| 2015 | $7,064 | $28,967 | $5,649 | $23,318 |
| 2014 | $7,011 | $28,967 | $5,649 | $23,318 |
| 2013 | $6,834 | $28,967 | $5,649 | $23,318 |
Source: Public Records
Map
Nearby Homes
- 1621 Church St
- 1801 Lyons St
- 1813 Dodge Ave
- 1739 Dodge Ave
- 1228 Emerson St Unit 304
- 1801 Brown Ave
- 2005 Darrow Ave
- 1720 Oak Ave Unit 502
- 1720 Oak Ave Unit 701
- 1720 Oak Ave Unit 706
- 2026 Green Bay Rd
- 1940 Dodge Ave
- 1585 Ridge Ave Unit 506
- 1585 Ridge Ave Unit 404
- 1718 Hovland Ct
- 1832 Hovland Ct
- 1640 Maple Ave Unit 1202
- 1640 Maple Ave Unit 304
- 1640 Maple Ave Unit 804
- 1720 Maple Ave Unit 2710
- 1734 Ashland Ave
- 1742 Ashland Ave
- 1732 Ashland Ave
- 1726 Ashland Ave
- 1722 Ashland Ave
- 1801 Ashland Ave
- 1810 Ashland Ave
- 1716 Ashland Ave
- 1725 Ashland Ave
- 1423 Lyons St
- 1723 Ashland Ave
- 1812 Ashland Ave
- 1721 Ashland Ave
- 1712 Ashland Ave
- 1414 Lyons St
- 1417 Lyons St
- 1811 Ashland Ave
- 1717 Ashland Ave
- 1818 Ashland Ave Unit 2
- 1818 Ashland Ave Unit 1