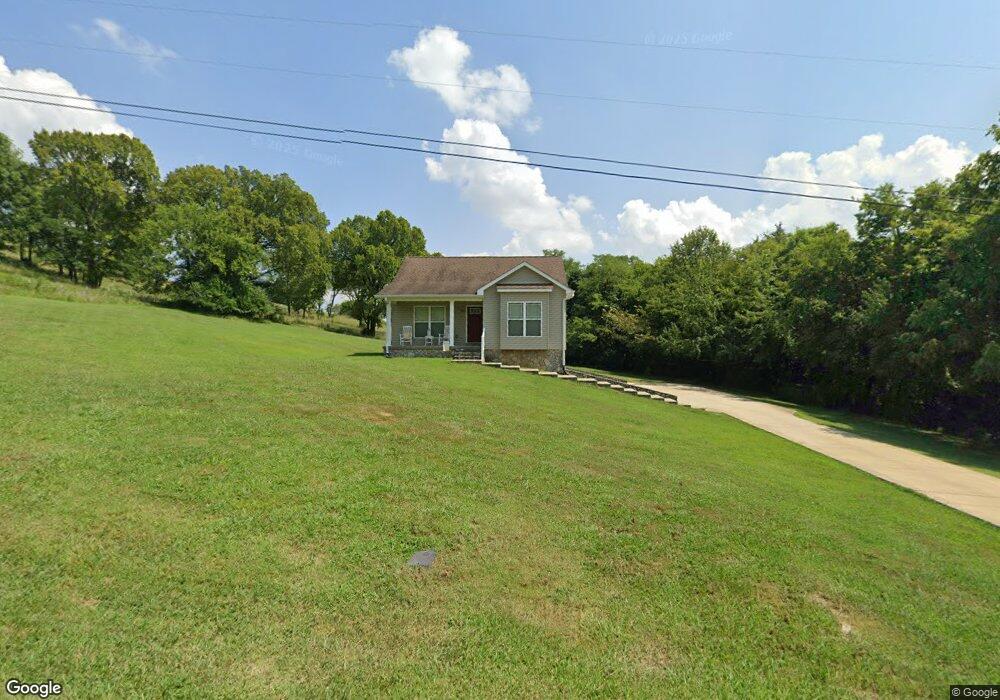
1740 Collins Hollow Rd Lewisburg, TN 37091
Estimated Value: $362,125 - $500,000
--
Bed
1
Bath
1,556
Sq Ft
$263/Sq Ft
Est. Value
About This Home
This home is located at 1740 Collins Hollow Rd, Lewisburg, TN 37091 and is currently estimated at $409,781, approximately $263 per square foot. 1740 Collins Hollow Rd is a home located in Marshall County with nearby schools including Marshall Elementary School, Oak Grove Elementary School, and Westhills Elementary School.
Ownership History
Date
Name
Owned For
Owner Type
Purchase Details
Closed on
May 23, 2011
Sold by
Dunivant Ronald L
Bought by
Hagood Brian T
Current Estimated Value
Home Financials for this Owner
Home Financials are based on the most recent Mortgage that was taken out on this home.
Original Mortgage
$171,800
Outstanding Balance
$118,897
Interest Rate
4.79%
Mortgage Type
Commercial
Estimated Equity
$290,884
Purchase Details
Closed on
Feb 10, 2010
Sold by
Poarch Jeff L
Bought by
Dunivant Ronald
Purchase Details
Closed on
Sep 2, 2009
Sold by
Richmond Eddie
Bought by
Poarch Jeff L
Purchase Details
Closed on
Oct 10, 2003
Sold by
John Gillespie
Bought by
Eddie Richmond and Eddie Patty
Purchase Details
Closed on
Nov 15, 2002
Sold by
Horton Jonathan D
Bought by
Gillespie John H
Purchase Details
Closed on
Nov 30, 1998
Sold by
Gillespie John H
Bought by
Horton Jonathan D
Purchase Details
Closed on
May 10, 1990
Bought by
Gillespie John H
Create a Home Valuation Report for This Property
The Home Valuation Report is an in-depth analysis detailing your home's value as well as a comparison with similar homes in the area
Home Values in the Area
Average Home Value in this Area
Purchase History
| Date | Buyer | Sale Price | Title Company |
|---|---|---|---|
| Hagood Brian T | $18,500 | -- | |
| Dunivant Ronald | $25,000 | -- | |
| Poarch Jeff L | $24,000 | -- | |
| Eddie Richmond | $16,000 | -- | |
| Gillespie John H | $10,000 | -- | |
| Horton Jonathan D | $10,000 | -- | |
| Gillespie John H | $6,000 | -- |
Source: Public Records
Mortgage History
| Date | Status | Borrower | Loan Amount |
|---|---|---|---|
| Open | Hagood Brian T | $171,800 |
Source: Public Records
Tax History Compared to Growth
Tax History
| Year | Tax Paid | Tax Assessment Tax Assessment Total Assessment is a certain percentage of the fair market value that is determined by local assessors to be the total taxable value of land and additions on the property. | Land | Improvement |
|---|---|---|---|---|
| 2024 | $1,454 | $79,950 | $6,750 | $73,200 |
| 2023 | $1,454 | $79,950 | $6,750 | $73,200 |
| 2022 | $1,454 | $79,950 | $6,750 | $73,200 |
| 2021 | $1,406 | $50,000 | $5,075 | $44,925 |
| 2020 | $1,287 | $50,000 | $5,075 | $44,925 |
| 2019 | $1,287 | $45,775 | $5,075 | $40,700 |
| 2018 | $1,264 | $45,775 | $5,075 | $40,700 |
| 2017 | $1,264 | $45,775 | $5,075 | $40,700 |
| 2016 | $1,225 | $38,050 | $4,800 | $33,250 |
| 2015 | $1,225 | $38,050 | $4,800 | $33,250 |
| 2014 | -- | $38,050 | $4,800 | $33,250 |
Source: Public Records
Map
Nearby Homes
- 1710 Collins Hollow Rd
- 1821 Gina Lynn Dr
- 0 Collins Hollow Rd
- 750 Lakehill Cir
- 1320 Rambo Hollow Rd
- 541 Skyline Dr S
- 1151 Green Valley Dr
- 795 Ashwood Ave
- 530 David Ave
- 475 Skyline Dr
- 486 David Ave
- 601 Joyce Ave
- 1505 Sandy St
- 1020 Corey Dr
- 575 Joyce Cir
- 425 Centennial Ave
- 1159 White Dr
- 2090 Wild Cherry Dr
- 2085 Wild Cherry Dr
- 2080 Wild Cherry Dr
- 1736 Collins Hollow Rd
- 1735 Collins Hollow Rd
- 1732 Collins Hollow Rd
- 1620 Ramblewood Dr
- 1731 Collins Hollow Rd
- 1730 Collins Hollow Rd
- 825 Skyline Dr S
- 850 Hillwood Dr S
- 845 Hillwood Dr S
- 901 Dories Ln
- 1630 Ramblewood Dr
- 1639 Ramblewood Dr
- 1729 Collins Hollow Rd
- 860 Hillwood Dr S
- 1720 Collins Hollow Rd
- 2112 Hillwood Dr S
- 900 Dories Ln
- 1 Hillwood Dr
- 1841 Gina Lynn Dr
- 3 Ramblewood Dr