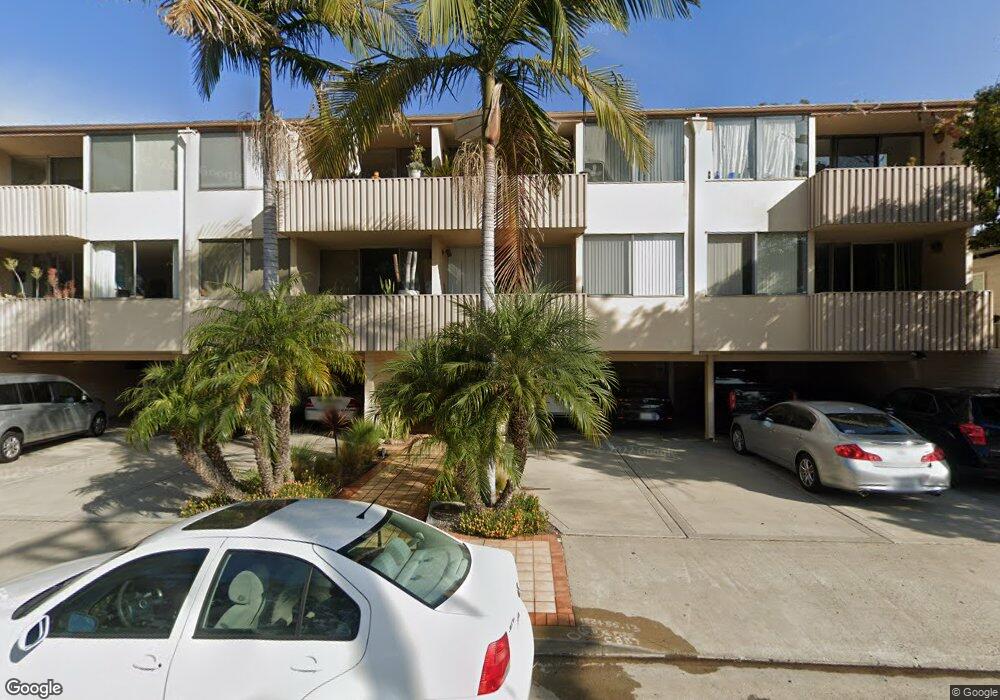
1740 Upas St Unit 6 San Diego, CA 92103
North Park NeighborhoodEstimated Value: $417,722 - $516,000
1
Bed
1
Bath
576
Sq Ft
$817/Sq Ft
Est. Value
About This Home
This home is located at 1740 Upas St Unit 6, San Diego, CA 92103 and is currently estimated at $470,681, approximately $817 per square foot. 1740 Upas St Unit 6 is a home located in San Diego County with nearby schools including Jefferson Elementary, Roosevelt International Middle School, and Kindred Montessori.
Ownership History
Date
Name
Owned For
Owner Type
Purchase Details
Closed on
Nov 20, 2015
Sold by
Edwards Stephan J and Edwards Gail
Bought by
Edwards Family Trust and Edwards Gail
Current Estimated Value
Purchase Details
Closed on
Aug 15, 2013
Sold by
Edwards Erika E
Bought by
Edwards Stephan J
Purchase Details
Closed on
Jan 29, 2004
Sold by
Lewbel George S and Hofmann Nancy
Bought by
Edwards Erika E
Home Financials for this Owner
Home Financials are based on the most recent Mortgage that was taken out on this home.
Original Mortgage
$50,000
Outstanding Balance
$23,434
Interest Rate
5.82%
Mortgage Type
Stand Alone First
Estimated Equity
$447,247
Purchase Details
Closed on
Nov 15, 1999
Sold by
Durall Maurice J
Bought by
Lewbel George S and Hofmann Nancy
Home Financials for this Owner
Home Financials are based on the most recent Mortgage that was taken out on this home.
Original Mortgage
$62,400
Interest Rate
7.82%
Purchase Details
Closed on
Aug 29, 1991
Purchase Details
Closed on
Jun 7, 1985
Create a Home Valuation Report for This Property
The Home Valuation Report is an in-depth analysis detailing your home's value as well as a comparison with similar homes in the area
Home Values in the Area
Average Home Value in this Area
Purchase History
| Date | Buyer | Sale Price | Title Company |
|---|---|---|---|
| Edwards Family Trust | -- | None Available | |
| Edwards Stephan J | -- | None Available | |
| Edwards Stephan J | -- | None Available | |
| Edwards Erika E | $250,000 | Chicago Title Co | |
| Lewbel George S | $78,000 | First American Title Ins Co | |
| -- | $80,000 | -- | |
| -- | $67,000 | -- |
Source: Public Records
Mortgage History
| Date | Status | Borrower | Loan Amount |
|---|---|---|---|
| Open | Edwards Erika E | $50,000 | |
| Previous Owner | Lewbel George S | $62,400 |
Source: Public Records
Tax History Compared to Growth
Tax History
| Year | Tax Paid | Tax Assessment Tax Assessment Total Assessment is a certain percentage of the fair market value that is determined by local assessors to be the total taxable value of land and additions on the property. | Land | Improvement |
|---|---|---|---|---|
| 2025 | $2,984 | $245,159 | $147,097 | $98,062 |
| 2024 | $2,984 | $240,353 | $144,213 | $96,140 |
| 2023 | $2,918 | $235,641 | $141,386 | $94,255 |
| 2022 | $2,840 | $231,021 | $138,614 | $92,407 |
| 2021 | $2,821 | $226,493 | $135,897 | $90,596 |
| 2020 | $2,787 | $224,172 | $134,504 | $89,668 |
| 2019 | $2,738 | $219,777 | $131,867 | $87,910 |
| 2018 | $2,561 | $215,469 | $129,282 | $86,187 |
| 2017 | $2,500 | $211,246 | $126,748 | $84,498 |
| 2016 | $2,460 | $207,105 | $124,263 | $82,842 |
| 2015 | $2,424 | $203,995 | $122,397 | $81,598 |
| 2014 | $2,387 | $200,000 | $120,000 | $80,000 |
Source: Public Records
Map
Nearby Homes
- 3420-30 Wilshire Terrace
- 3524-26 Georgia St
- 3405 Florida St Unit 410
- 3620 Park Blvd Unit 11
- 3721 Indiana St
- 3740 Park Blvd Unit 210
- 1907 Robinson Ave Unit 309
- 1271 Brookes Terrace
- 1607 1609 Robinson Ave
- 3536 Louisiana St
- 3660 Mississippi St
- 3678 Richmond St
- 3770 Georgia St
- 3760 Florida St
- 3760 Florida St Unit 209
- 3533 Louisiana St
- 3537 Louisiana St
- 1010 Myrtle Way
- 3790 Florida St Unit AL01
- 3790 Florida St Unit B216
- 1740 Upas St Unit 25
- 1740 Upas St Unit 24
- 1740 Upas St Unit 23
- 1740 Upas St Unit 22
- 1740 Upas St Unit 21
- 1740 Upas St Unit 20
- 1740 Upas St Unit 19
- 1740 Upas St Unit 18
- 1740 Upas St Unit 17
- 1740 Upas St Unit 16
- 1740 Upas St Unit 15
- 1740 Upas St Unit 14
- 1740 Upas St Unit 12
- 1740 Upas St Unit 11
- 1740 Upas St Unit 10
- 1740 Upas St Unit 9
- 1740 Upas St Unit 8
- 1740 Upas St Unit 7
- 1740 Upas St Unit 5
- 1740 Upas St Unit 4