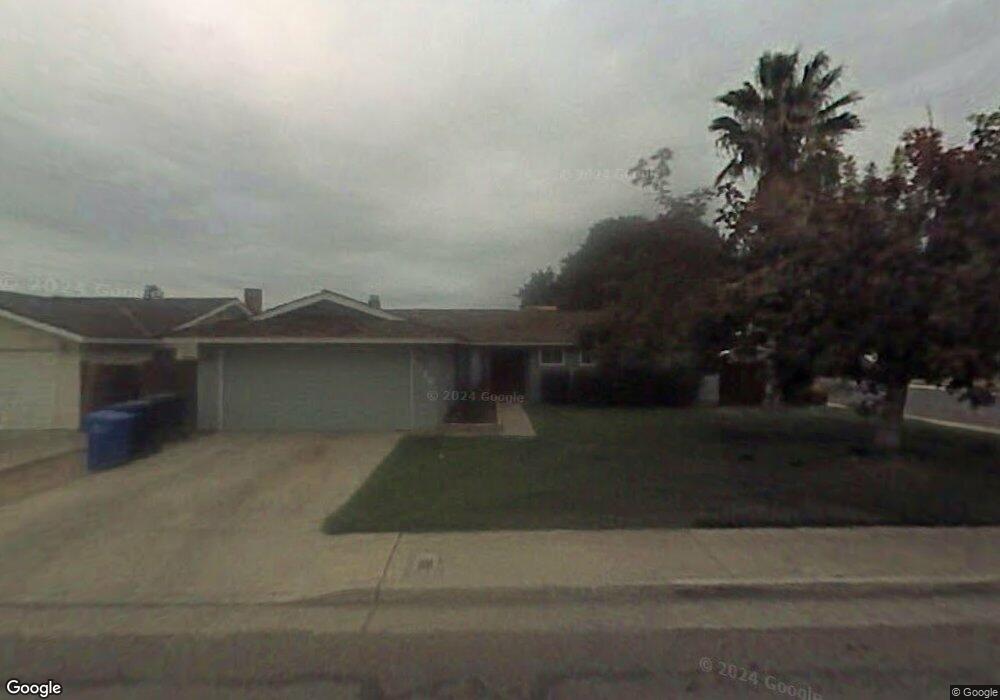
1740 W Terry Cir Porterville, CA 93257
Porterville Northwest NeighborhoodEstimated Value: $298,870 - $333,000
3
Beds
2
Baths
1,254
Sq Ft
$252/Sq Ft
Est. Value
About This Home
This home is located at 1740 W Terry Cir, Porterville, CA 93257 and is currently estimated at $315,968, approximately $251 per square foot. 1740 W Terry Cir is a home located in Tulare County with nearby schools including Oak Grove Elementary School, Burton Middle School, and Monache High School.
Ownership History
Date
Name
Owned For
Owner Type
Purchase Details
Closed on
Jun 26, 2012
Sold by
Govea Juvencio
Bought by
Bronson Stanford Lynn and Bronson Gail
Current Estimated Value
Purchase Details
Closed on
Jan 11, 2006
Sold by
Hellinga Denise
Bought by
Govea Juvencio and Govea Maritania
Home Financials for this Owner
Home Financials are based on the most recent Mortgage that was taken out on this home.
Original Mortgage
$175,200
Interest Rate
7.2%
Mortgage Type
New Conventional
Purchase Details
Closed on
Aug 2, 2005
Sold by
Canfield Barbara
Bought by
Hellinga Paul and Hellinga Denise
Purchase Details
Closed on
May 14, 2001
Sold by
Rodriguez Barbara L
Bought by
Rodriguez Barbara L
Home Financials for this Owner
Home Financials are based on the most recent Mortgage that was taken out on this home.
Original Mortgage
$65,250
Interest Rate
7.03%
Purchase Details
Closed on
Jul 13, 1998
Sold by
Rodriguez Raymond J
Bought by
Rodriguez Barbara L
Create a Home Valuation Report for This Property
The Home Valuation Report is an in-depth analysis detailing your home's value as well as a comparison with similar homes in the area
Home Values in the Area
Average Home Value in this Area
Purchase History
| Date | Buyer | Sale Price | Title Company |
|---|---|---|---|
| Bronson Stanford Lynn | $83,000 | Chicago Title Company | |
| Govea Juvencio | $219,000 | First American Title Co | |
| Hellinga Paul | $200,000 | First American Title Co | |
| Rodriguez Barbara L | -- | Fidelity National Title Co | |
| Rodriguez Barbara L | -- | -- |
Source: Public Records
Mortgage History
| Date | Status | Borrower | Loan Amount |
|---|---|---|---|
| Previous Owner | Govea Juvencio | $175,200 | |
| Previous Owner | Rodriguez Barbara L | $65,250 |
Source: Public Records
Tax History Compared to Growth
Tax History
| Year | Tax Paid | Tax Assessment Tax Assessment Total Assessment is a certain percentage of the fair market value that is determined by local assessors to be the total taxable value of land and additions on the property. | Land | Improvement |
|---|---|---|---|---|
| 2025 | $1,074 | $102,209 | $30,786 | $71,423 |
| 2024 | $1,074 | $100,206 | $30,183 | $70,023 |
| 2023 | $1,077 | $98,242 | $29,592 | $68,650 |
| 2022 | $1,035 | $96,316 | $29,012 | $67,304 |
| 2021 | $1,019 | $94,427 | $28,443 | $65,984 |
| 2020 | $1,001 | $93,458 | $28,151 | $65,307 |
| 2019 | $1,000 | $91,625 | $27,599 | $64,026 |
| 2018 | $956 | $89,829 | $27,058 | $62,771 |
| 2017 | $941 | $88,067 | $26,527 | $61,540 |
| 2016 | $896 | $86,340 | $26,007 | $60,333 |
| 2015 | $864 | $85,043 | $25,616 | $59,427 |
| 2014 | $864 | $83,377 | $25,114 | $58,263 |
Source: Public Records
Map
Nearby Homes
- 1750 W Terry Cir
- 1691 Terry Ct
- 1041 Greenfield Dr
- 1681 W Wall Ln
- 1644 Mccomb Ave
- 1857 W Westfield Ave
- 1926 W Nancy Ave
- 1121 N Lindale Way
- 1076 N Beverly St
- 1690 Memory Ln
- 1730 W Grand Ave
- 0 Pioneer Ave Unit 233651
- 595 N Salisbury St
- 1245 Atkins St
- 2164 W San Lucia Ct
- 1045 N Westside St
- 1370 Lindale Place
- 1421 Pamela Cir
- 1771 W Aurora Ct
- 1555 Verdugo Place