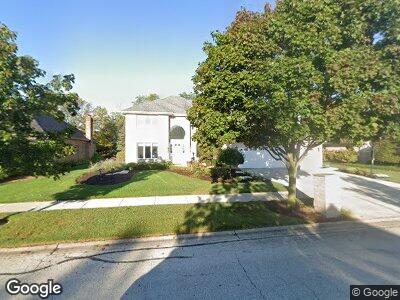
17400 Deer Point Dr Orland Park, IL 60467
Grasslands NeighborhoodEstimated Value: $656,329 - $777,000
5
Beds
3
Baths
3,334
Sq Ft
$217/Sq Ft
Est. Value
About This Home
This home is located at 17400 Deer Point Dr, Orland Park, IL 60467 and is currently estimated at $721,832, approximately $216 per square foot. 17400 Deer Point Dr is a home located in Cook County with nearby schools including Meadow Ridge School, Orland Center School, and Century Junior High School.
Ownership History
Date
Name
Owned For
Owner Type
Purchase Details
Closed on
Apr 12, 2007
Sold by
Jacobson Richard L and Jacobson Catherine
Bought by
Karambenis Bill S and Karambenis Joanne
Current Estimated Value
Home Financials for this Owner
Home Financials are based on the most recent Mortgage that was taken out on this home.
Original Mortgage
$340,000
Interest Rate
6.19%
Mortgage Type
New Conventional
Purchase Details
Closed on
Oct 13, 2000
Sold by
Prairie Bank & Trust Company
Bought by
Mileusnich Dane and Mileusnich Dawn
Home Financials for this Owner
Home Financials are based on the most recent Mortgage that was taken out on this home.
Original Mortgage
$316,480
Interest Rate
14.87%
Create a Home Valuation Report for This Property
The Home Valuation Report is an in-depth analysis detailing your home's value as well as a comparison with similar homes in the area
Home Values in the Area
Average Home Value in this Area
Purchase History
| Date | Buyer | Sale Price | Title Company |
|---|---|---|---|
| Karambenis Bill S | $540,000 | Attorneys Title Guaranty Fun | |
| Mileusnich Dane | $396,000 | -- |
Source: Public Records
Mortgage History
| Date | Status | Borrower | Loan Amount |
|---|---|---|---|
| Open | Karambenis Bill S | $300,000 | |
| Closed | Karambenis Bill S | $329,000 | |
| Closed | Karambenis Bill S | $340,000 | |
| Previous Owner | Jacobson Richard L | $322,700 | |
| Previous Owner | Jacobson Richard L | $336,000 | |
| Previous Owner | Mileusnich Dane | $316,480 |
Source: Public Records
Tax History Compared to Growth
Tax History
| Year | Tax Paid | Tax Assessment Tax Assessment Total Assessment is a certain percentage of the fair market value that is determined by local assessors to be the total taxable value of land and additions on the property. | Land | Improvement |
|---|---|---|---|---|
| 2024 | $10,948 | $63,126 | $8,415 | $54,711 |
| 2023 | $10,948 | $64,000 | $8,415 | $55,585 |
| 2022 | $10,948 | $39,967 | $7,293 | $32,674 |
| 2021 | $10,599 | $39,966 | $7,293 | $32,673 |
| 2020 | $10,682 | $41,463 | $7,293 | $34,170 |
| 2019 | $9,893 | $39,472 | $6,732 | $32,740 |
| 2018 | $10,047 | $41,072 | $6,732 | $34,340 |
| 2017 | $10,933 | $45,276 | $6,732 | $38,544 |
| 2016 | $10,728 | $40,945 | $6,171 | $34,774 |
| 2015 | $10,590 | $40,945 | $6,171 | $34,774 |
| 2014 | $10,448 | $40,945 | $6,171 | $34,774 |
| 2013 | $9,769 | $40,745 | $6,171 | $34,574 |
Source: Public Records
Map
Nearby Homes
- 10901 Fawn Trail Dr
- 10900 Beth Dr Unit 24
- 10825 Fawn Trail Dr
- 17513 Pamela Ln Unit 78
- 10958 New Mexico Ct Unit 166
- 10728 Millers Way
- 17247 Lakebrook Dr
- 11224 Marley Brook Ct
- 17740 New Hampshire Ct Unit 12
- 17740 Washington Ct Unit 249
- 10957 New Mexico Ct Unit 161
- 11143 Wisconsin Ct Unit 3D
- 17325 Lakebrook Dr
- 11343 Brook Hill Dr
- 17828 Massachusetts Ct Unit 34
- 9601 W 179th St
- 17844 Columbus Ct Unit 25
- 17035 Clover Dr
- 10935 California Ct Unit 185
- 17932 Alaska Ct Unit 21
- 17400 Deer Point Dr
- 17356 Deer Point Dr
- 17408 Deer Point Dr
- 17433 110th Ct
- 17348 Deer Point Dr
- 17416 Deer Point Dr
- 17405 Deer Point Dr
- 17359 Deer Point Dr
- 17413 Deer Point Dr
- 17351 Deer Point Dr
- 17340 Deer Point Dr
- 17424 Deer Point Dr
- 17421 Deer Point Dr
- 17343 Deer Point Dr
- 17404 Deer Creek Dr
- 17471 110th Ct
- 17356 Deer Creek Dr
- 17412 Deer Creek Dr
- 17332 Deer Point Dr
- 17348 Deer Creek Dr