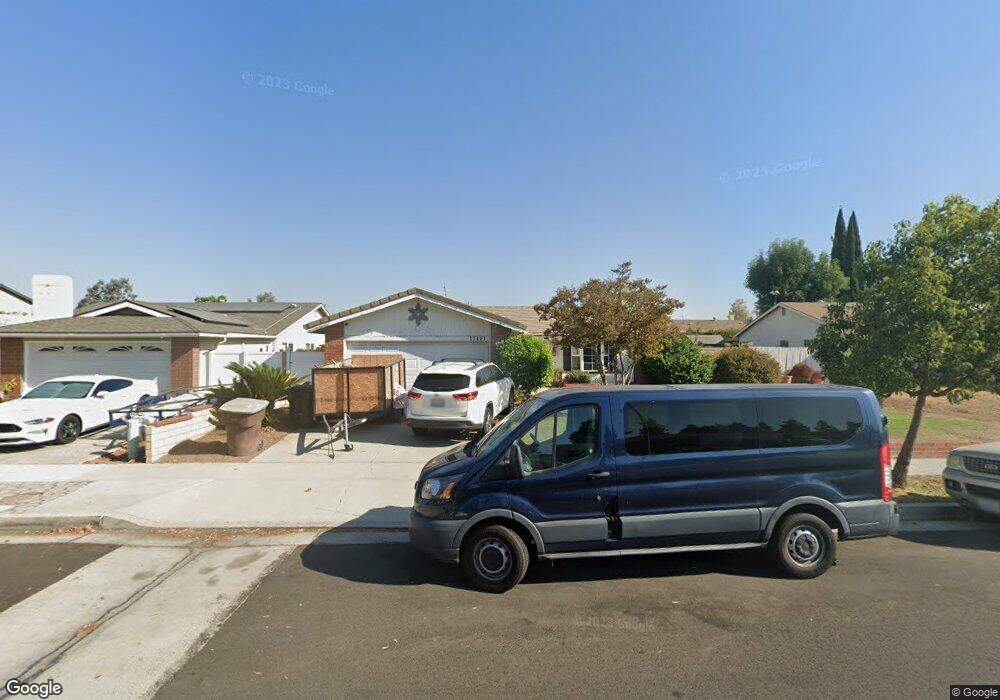
17411 Melbourne Ln Yorba Linda, CA 92886
Estimated Value: $1,028,400 - $1,276,000
3
Beds
2
Baths
1,148
Sq Ft
$970/Sq Ft
Est. Value
About This Home
This home is located at 17411 Melbourne Ln, Yorba Linda, CA 92886 and is currently estimated at $1,114,100, approximately $970 per square foot. 17411 Melbourne Ln is a home located in Orange County with nearby schools including Van Buren Elementary School, Kraemer Middle School, and Valencia High School.
Ownership History
Date
Name
Owned For
Owner Type
Purchase Details
Closed on
Feb 8, 2007
Sold by
Bernstein Dion S and Bernstein Letitia A
Bought by
Rodriguez Jesse Louis
Current Estimated Value
Home Financials for this Owner
Home Financials are based on the most recent Mortgage that was taken out on this home.
Original Mortgage
$570,000
Interest Rate
6.13%
Mortgage Type
Purchase Money Mortgage
Purchase Details
Closed on
Jun 12, 1996
Sold by
Texas Commerce Bank National Assn
Bought by
Bernstein Dion S and Bernstein Letitia A
Home Financials for this Owner
Home Financials are based on the most recent Mortgage that was taken out on this home.
Original Mortgage
$140,696
Interest Rate
8.03%
Mortgage Type
FHA
Purchase Details
Closed on
Mar 8, 1996
Sold by
Mafla Mary D
Bought by
Texas Commerce Bank National Assn
Create a Home Valuation Report for This Property
The Home Valuation Report is an in-depth analysis detailing your home's value as well as a comparison with similar homes in the area
Home Values in the Area
Average Home Value in this Area
Purchase History
| Date | Buyer | Sale Price | Title Company |
|---|---|---|---|
| Rodriguez Jesse Louis | $600,000 | Fidelity National Title Co | |
| Bernstein Dion S | $168,000 | Fidelity National Title Ins | |
| Texas Commerce Bank National Assn | $153,000 | -- |
Source: Public Records
Mortgage History
| Date | Status | Borrower | Loan Amount |
|---|---|---|---|
| Previous Owner | Rodriguez Jesse Louis | $570,000 | |
| Previous Owner | Bernstein Dion S | $140,696 |
Source: Public Records
Tax History Compared to Growth
Tax History
| Year | Tax Paid | Tax Assessment Tax Assessment Total Assessment is a certain percentage of the fair market value that is determined by local assessors to be the total taxable value of land and additions on the property. | Land | Improvement |
|---|---|---|---|---|
| 2025 | $8,983 | $803,865 | $691,770 | $112,095 |
| 2024 | $8,983 | $788,103 | $678,205 | $109,898 |
| 2023 | $8,826 | $772,650 | $664,906 | $107,744 |
| 2022 | $8,745 | $757,500 | $651,868 | $105,632 |
| 2021 | $8,591 | $742,648 | $639,087 | $103,561 |
| 2020 | $7,471 | $641,580 | $556,232 | $85,348 |
| 2019 | $7,213 | $629,000 | $545,325 | $83,675 |
| 2018 | $7,257 | $629,000 | $545,325 | $83,675 |
| 2017 | $7,274 | $629,000 | $545,325 | $83,675 |
| 2016 | $6,795 | $586,000 | $502,325 | $83,675 |
| 2015 | $6,471 | $555,000 | $471,325 | $83,675 |
| 2014 | $6,007 | $518,822 | $435,147 | $83,675 |
Source: Public Records
Map
Nearby Homes
- 17225 Orange Blossom Ln
- 5130 Webb Place
- 5661 Casa Loma Ave
- 1524 Larsen Ln
- 1527 Evans Ln
- 17842 Caballo Dr
- 17841 Buena Vista Ave
- 5141 Siesta Ln
- 5231 Highland Ave
- 17001 La Kenice Way
- 1261 Desoto St
- 1561 Ismail Place
- 732 Olivier Dr
- 726 Olivier Dr
- 718 Olivier Dr
- 714 Olivier Dr
- 727 Olivier Dr
- 708 Mcfadden St
- 582 Mcfadden St
- 707 Olivier Dr
- 17421 Melbourne Ln
- 17391 Melbourne Ln
- 17412 Yorkshire Ave
- 17392 Yorkshire Ave
- 17431 Melbourne Ln
- 17371 Melbourne Ln
- 17422 Yorkshire Ave
- 17382 Yorkshire Ave
- 17412 Melbourne Ln
- 17432 Yorkshire Ave
- 17422 Melbourne Ln
- 17361 Melbourne Ln
- 17382 Melbourne Ln
- 17372 Yorkshire Ave
- 17432 Melbourne Ln
- 17372 Melbourne Ln
- 17362 Yorkshire Ave
- 17351 Melbourne Ln
- 17362 Melbourne Ln
- 5572 Raintree St