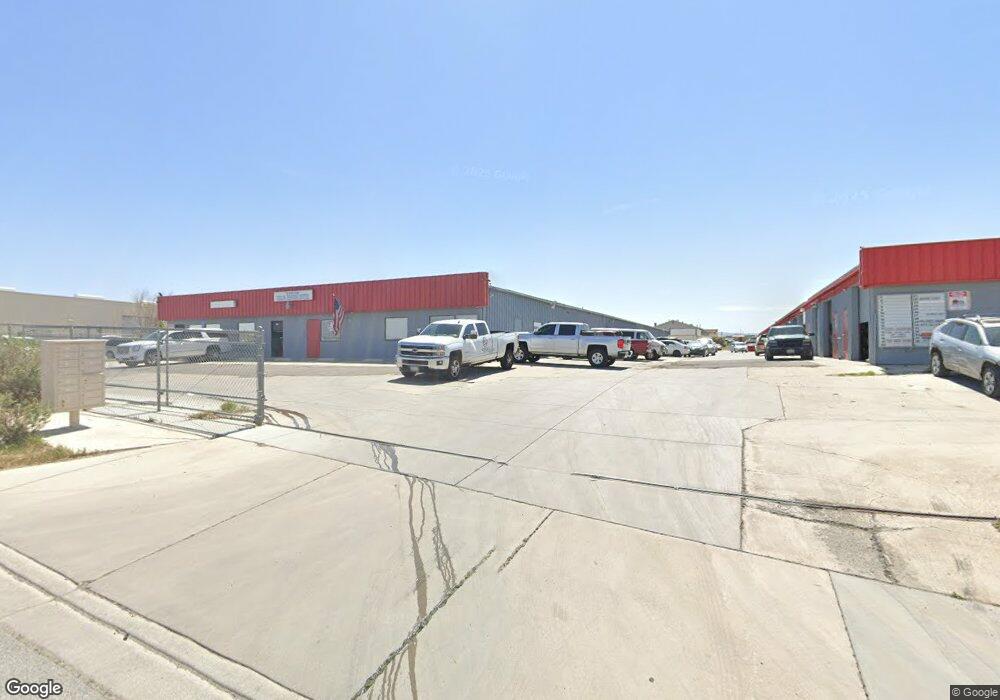
17415 Catalpa St Unit 15 Hesperia, CA 92345
--
Bed
3
Baths
30,064
Sq Ft
2.5
Acres
About This Home
This home is located at 17415 Catalpa St Unit 15, Hesperia, CA 92345. 17415 Catalpa St Unit 15 is a home located in San Bernardino County with nearby schools including Juniper Elementary School, Ranchero Middle School, and Sultana High School.
Ownership History
Date
Name
Owned For
Owner Type
Purchase Details
Closed on
Jan 18, 2023
Sold by
Bentow Zev Jeff
Bought by
2022 Zev Jeff Bentow Revocable Trust
Purchase Details
Closed on
May 20, 2005
Sold by
Kaur Gill Telokjan Singh
Bought by
Bentow Jeff
Home Financials for this Owner
Home Financials are based on the most recent Mortgage that was taken out on this home.
Original Mortgage
$440,000
Interest Rate
5.61%
Mortgage Type
Commercial
Purchase Details
Closed on
Jun 25, 2004
Sold by
Kaur Gill Telokjan Singh
Bought by
Kaur Gill Telokjan Singh and Kaur Gill Harpal
Purchase Details
Closed on
Jun 15, 2004
Sold by
Kaur Gill Telokjan Singh
Bought by
Kaur Gill Telokjan Singh and Kaur Gill Harpal
Purchase Details
Closed on
May 12, 1994
Sold by
High Desert National Bank
Bought by
Kaur Gill Telokjan Singh and Kaur Gill Harpal
Home Financials for this Owner
Home Financials are based on the most recent Mortgage that was taken out on this home.
Original Mortgage
$605,000
Interest Rate
8.3%
Mortgage Type
Commercial
Create a Home Valuation Report for This Property
The Home Valuation Report is an in-depth analysis detailing your home's value as well as a comparison with similar homes in the area
Home Values in the Area
Average Home Value in this Area
Purchase History
| Date | Buyer | Sale Price | Title Company |
|---|---|---|---|
| 2022 Zev Jeff Bentow Revocable Trust | -- | -- | |
| Bentow Jeff | -- | Chicago Title Company | |
| Kaur Gill Telokjan Singh | -- | -- | |
| Kaur Gill Telokjan Singh | -- | -- | |
| Kaur Gill Telokjan Singh | $705,000 | Continental Lawyers Title Co |
Source: Public Records
Mortgage History
| Date | Status | Borrower | Loan Amount |
|---|---|---|---|
| Previous Owner | Bentow Jeff | $440,000 | |
| Previous Owner | Kaur Gill Telokjan Singh | $605,000 |
Source: Public Records
Tax History Compared to Growth
Tax History
| Year | Tax Paid | Tax Assessment Tax Assessment Total Assessment is a certain percentage of the fair market value that is determined by local assessors to be the total taxable value of land and additions on the property. | Land | Improvement |
|---|---|---|---|---|
| 2025 | $19,240 | $1,803,897 | $222,753 | $1,581,144 |
| 2024 | $19,240 | $1,768,526 | $218,385 | $1,550,141 |
| 2023 | $19,027 | $1,733,849 | $214,103 | $1,519,746 |
| 2022 | $18,580 | $1,699,852 | $209,905 | $1,489,947 |
| 2021 | $18,237 | $1,666,521 | $205,789 | $1,460,732 |
| 2020 | $18,018 | $1,649,433 | $203,679 | $1,445,754 |
| 2019 | $17,638 | $1,617,091 | $199,685 | $1,417,406 |
| 2018 | $17,293 | $1,585,384 | $195,770 | $1,389,614 |
| 2017 | $16,982 | $1,554,298 | $191,931 | $1,362,367 |
| 2016 | $16,613 | $1,523,822 | $188,168 | $1,335,654 |
| 2015 | -- | $1,500,933 | $185,342 | $1,315,591 |
| 2014 | $16,175 | $1,471,531 | $181,711 | $1,289,820 |
Source: Public Records
Map
Nearby Homes
- 17357 Capri St
- 0 Darwin Ave Unit HD25121291
- 17886 Hackberry St
- 17820 Sycamore St
- 17933 Deodar St
- 11598 Peach Ave
- 0 Alder St
- 11319 1st Ave
- 18021 Birch St
- 16800 Sycamore St
- 17831 Pitache St
- 17311 Bear Valley Rd
- 10903 E Ave
- 11430 2nd Ave
- 10793 G Ave
- 18125 Hackberry St
- 17840 Talisman St
- 0 Yuma St
- 18063 Pitache St
- 10701 G Ave Unit 12
- 17415 Catalpa St
- 17415 Catalpa St Unit 34&A3
- 17415 Catalpa St Unit A3
- 17435 Catalpa St Unit 2A
- 11485 Santa fe Ave E Unit C
- 11485 Santa fe Ave E Unit I
- 11485 Santa fe Ave E Unit E
- 11485 Santa fe Ave E Unit J
- 11485 Santa fe Ave E Unit H
- 11485 Santa fe Ave E Unit F
- 11485 Santa fe Ave E Unit D
- 0 Hackberry St Unit CV18098821
- 0 Hackberry St Unit I10047758
- 0 Hackberry St Unit P830502
- 0 Hackberry St Unit CV16050783
- 0 Hackberry St Unit IV17026678
- 0 Hackberry St Unit 213007080
- 0 Hackberry St Unit 375293
- 0 Hackberry St Unit 382803
- 0 Hackberry St Unit 414272