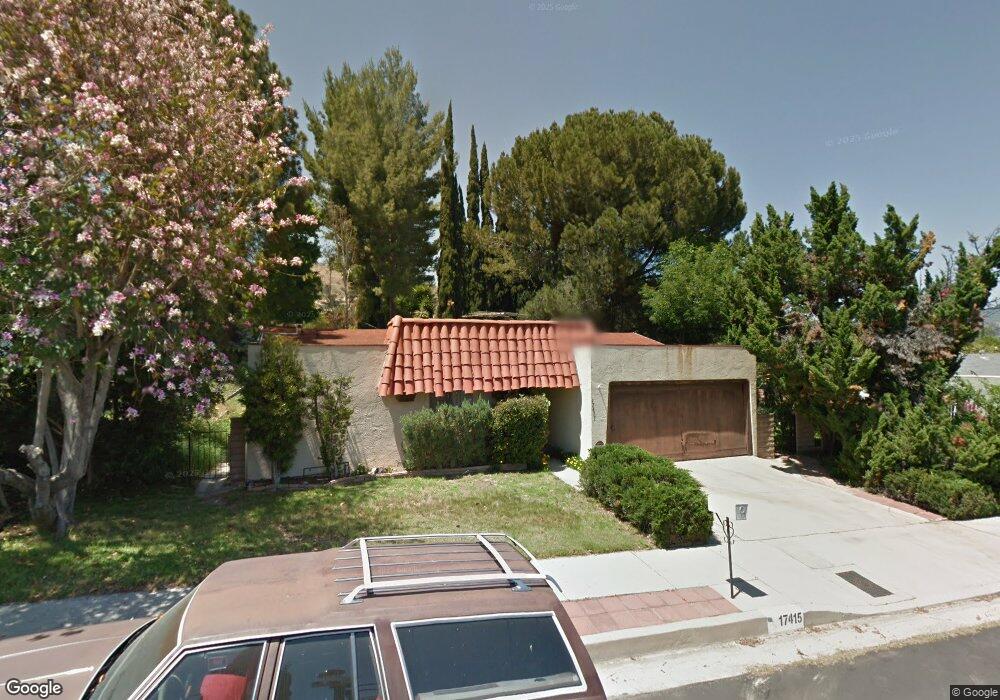
17415 Trosa St Granada Hills, CA 91344
Estimated Value: $1,008,071 - $1,245,000
3
Beds
3
Baths
1,787
Sq Ft
$636/Sq Ft
Est. Value
About This Home
This home is located at 17415 Trosa St, Granada Hills, CA 91344 and is currently estimated at $1,137,268, approximately $636 per square foot. 17415 Trosa St is a home located in Los Angeles County with nearby schools including Robert Frost Middle School, John F. Kennedy High School, and Valley Academy of Arts & Sciences.
Ownership History
Date
Name
Owned For
Owner Type
Purchase Details
Closed on
Nov 27, 2018
Sold by
Maggio Robert J and Pasay Maggio Susana
Bought by
Maggio Robert J and Pasay Maggio Susana
Current Estimated Value
Purchase Details
Closed on
Jun 27, 2012
Sold by
Pasay Maggio Susana
Bought by
Maggio Robert J
Home Financials for this Owner
Home Financials are based on the most recent Mortgage that was taken out on this home.
Original Mortgage
$90,000
Outstanding Balance
$60,485
Interest Rate
3.12%
Mortgage Type
New Conventional
Estimated Equity
$1,076,783
Purchase Details
Closed on
May 2, 1996
Sold by
Mccarron Thomas J
Bought by
Maggio Robert J
Home Financials for this Owner
Home Financials are based on the most recent Mortgage that was taken out on this home.
Original Mortgage
$148,000
Interest Rate
7.97%
Create a Home Valuation Report for This Property
The Home Valuation Report is an in-depth analysis detailing your home's value as well as a comparison with similar homes in the area
Home Values in the Area
Average Home Value in this Area
Purchase History
| Date | Buyer | Sale Price | Title Company |
|---|---|---|---|
| Maggio Robert J | -- | None Available | |
| Maggio Robert J | -- | None Available | |
| Maggio Robert J | -- | Landsafe Title Of California | |
| Maggio Robert J | $185,000 | Continental Lawyers Title Co |
Source: Public Records
Mortgage History
| Date | Status | Borrower | Loan Amount |
|---|---|---|---|
| Open | Maggio Robert J | $90,000 | |
| Closed | Maggio Robert J | $148,000 |
Source: Public Records
Tax History Compared to Growth
Tax History
| Year | Tax Paid | Tax Assessment Tax Assessment Total Assessment is a certain percentage of the fair market value that is determined by local assessors to be the total taxable value of land and additions on the property. | Land | Improvement |
|---|---|---|---|---|
| 2025 | $3,954 | $307,309 | $145,016 | $162,293 |
| 2024 | $3,954 | $301,284 | $142,173 | $159,111 |
| 2023 | $3,882 | $295,378 | $139,386 | $155,992 |
| 2022 | $3,711 | $289,587 | $136,653 | $152,934 |
| 2021 | $3,658 | $283,910 | $133,974 | $149,936 |
| 2019 | $3,553 | $275,491 | $130,001 | $145,490 |
| 2018 | $3,455 | $270,090 | $127,452 | $142,638 |
| 2016 | $3,288 | $259,603 | $122,503 | $137,100 |
| 2015 | $3,242 | $255,704 | $120,663 | $135,041 |
| 2014 | $3,260 | $250,696 | $118,300 | $132,396 |
Source: Public Records
Map
Nearby Homes
- 12701 Norlina Place
- 17531 Doric St
- 12790 Jolette Ave
- 12818 Neon Way
- 17465 Tuscan Dr
- 12571 Henzie Place
- 12525 Daryl Ave
- 0 Sesnon Blvd Unit 25600261
- 17252 Wentzel Way
- 12444 Marva Ave
- 17350 Angelaine Way
- 17148 Lisette St
- 17816 Tuscan Dr
- 17211 Orozco St
- 12128 Nugent Dr
- 12651 Darla Ave
- 12648 Darla Ave
- 17042 Lisette St
- 12670 Jimeno Ave
- 17923 Lone Oak Dr
- 17425 Trosa St
- 17401 Trosa St
- 12726 Daryl Ave
- 12739 Deon Place
- 17412 Trosa St
- 17404 Trosa St
- 17418 Trosa St
- 17400 Trosa St
- 17424 Trosa St
- 12740 Daryl Ave
- 17362 Trosa St
- 17355 Trosa St
- 12753 Deon Place
- 12713 Daryl Ave
- 12721 Daryl Ave
- 12740 Deon Place
- 12668 Daryl Ave
- 12727 Daryl Ave
- 17356 Trosa St
- 12679 Daryl Ave