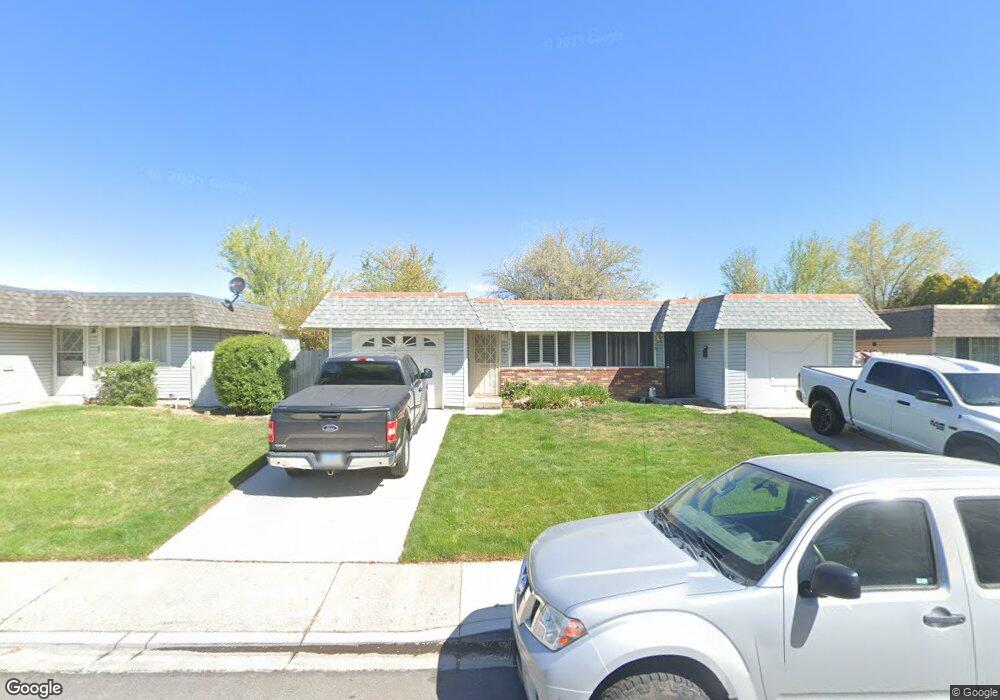
1742 Gault Way Unit B Sparks, NV 89431
North Rock NeighborhoodEstimated Value: $292,000 - $308,000
3
Beds
2
Baths
1,044
Sq Ft
$288/Sq Ft
Est. Value
About This Home
This home is located at 1742 Gault Way Unit B, Sparks, NV 89431 and is currently estimated at $300,735, approximately $288 per square foot. 1742 Gault Way Unit B is a home located in Washoe County with nearby schools including Alice Maxwell Elementary School, Sparks Middle School, and Sparks High School.
Ownership History
Date
Name
Owned For
Owner Type
Purchase Details
Closed on
Jun 22, 2016
Sold by
Colvig Lynne J
Bought by
Holmen Timothy and Holmen Gwen
Current Estimated Value
Purchase Details
Closed on
Oct 9, 2013
Sold by
Colvig Cameron Lynne J
Bought by
Colvig Lynne J and Lynne Janeth Colvig Living Trust
Purchase Details
Closed on
Oct 1, 2013
Sold by
Colvig Lynne J
Bought by
Colvig Lynne J and Lynne Janeth Colvig Living Trust
Purchase Details
Closed on
Jun 25, 2010
Sold by
Robello Clyde and Robello Dorothy
Bought by
Colvig Cameron Lynne
Purchase Details
Closed on
Dec 9, 2009
Sold by
Cruz Javier Lopez
Bought by
Robello Clyde and Robello Dorothy
Purchase Details
Closed on
Jul 26, 2006
Sold by
Wagner Sandra C
Bought by
Cruz Javier Lopez
Home Financials for this Owner
Home Financials are based on the most recent Mortgage that was taken out on this home.
Original Mortgage
$173,850
Interest Rate
10.12%
Mortgage Type
Unknown
Create a Home Valuation Report for This Property
The Home Valuation Report is an in-depth analysis detailing your home's value as well as a comparison with similar homes in the area
Home Values in the Area
Average Home Value in this Area
Purchase History
| Date | Buyer | Sale Price | Title Company |
|---|---|---|---|
| Holmen Timothy | $135,000 | Ticor Title Q | |
| Colvig Lynne J | -- | None Available | |
| Colvig Lynne J | -- | None Available | |
| Colvig Cameron Lynne | $75,000 | First Centennial Reno | |
| Robello Clyde | $49,000 | First Centennial Reno | |
| Cruz Javier Lopez | $183,000 | First American Title |
Source: Public Records
Mortgage History
| Date | Status | Borrower | Loan Amount |
|---|---|---|---|
| Previous Owner | Cruz Javier Lopez | $173,850 |
Source: Public Records
Tax History Compared to Growth
Tax History
| Year | Tax Paid | Tax Assessment Tax Assessment Total Assessment is a certain percentage of the fair market value that is determined by local assessors to be the total taxable value of land and additions on the property. | Land | Improvement |
|---|---|---|---|---|
| 2025 | $573 | $37,851 | $24,633 | $13,218 |
| 2024 | $573 | $36,586 | $23,247 | $13,339 |
| 2023 | $557 | $31,882 | $20,381 | $11,502 |
| 2022 | $541 | $26,370 | $16,632 | $9,738 |
| 2021 | $525 | $20,198 | $10,647 | $9,551 |
| 2020 | $509 | $20,600 | $10,647 | $9,953 |
| 2019 | $494 | $20,845 | $10,836 | $10,009 |
| 2018 | $480 | $16,721 | $6,615 | $10,106 |
| 2017 | $466 | $16,496 | $6,384 | $10,112 |
| 2016 | $454 | $15,775 | $5,220 | $10,555 |
| 2015 | $453 | $15,294 | $4,223 | $11,071 |
| 2014 | $440 | $13,741 | $2,893 | $10,848 |
| 2013 | -- | $13,293 | $2,294 | $10,999 |
Source: Public Records
Map
Nearby Homes
- 1731 Gault Way Unit D
- 1620 Gault Way
- 1595 York Way
- 0 N Mccarran Blvd Unit 250052909
- 1345 Plymouth Way
- 2154 Oppio St
- 1799 Vance Way
- 1655 Byrd Dr
- 1125 Dodson Way
- 1160 York Way
- 3269 Valley Forge Way
- 1110 Xman Way
- 3116 Sterling Ridge Cir
- 3516 Brassie Dr
- 3230 Creekside Ln Unit 1
- 1780 Greenbrae Dr
- 1124 Sbragia Way
- 5530 High Rock Way
- 3211 Cityview Terrace
- 3580 Mashie Ct Unit 1
- 1742 Gault Way Unit Ground Level
- 1740 Gault Way Unit A
- 1760 Gault Way Unit C
- 1762 Gault Way Unit D
- 1722 Gault Way Unit D
- 1720 Gault Way
- 1770 Gault Way
- 1712 Gault Way Unit B
- 1772 Gault Way
- 1710 Gault Way Unit A
- 1757 Gault Way Unit B
- 1733 Gault Way Unit C
- 1759 Gault Way
- 2678 Adel Way Unit D
- 1702 Gault Way Unit D
- 1719 Gault Way
- 1790 Gault Way Unit E
- 1717 Gault Way
- 2676 Adel Way
- 1782 Gault Way Unit E