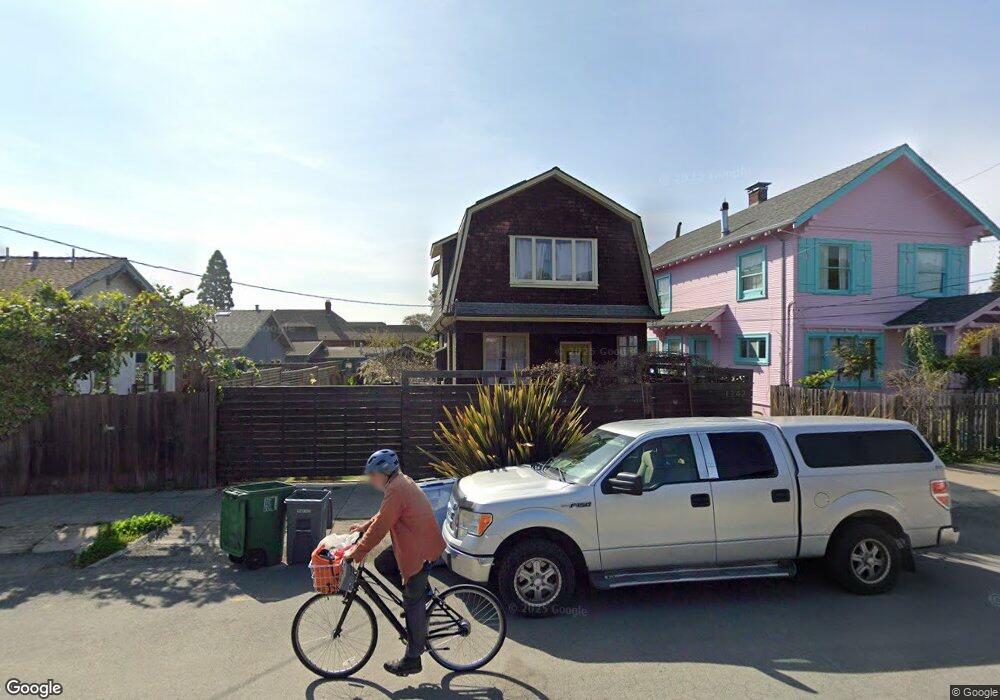
1742 Grant St Berkeley, CA 94703
North Berkeley NeighborhoodEstimated Value: $1,229,000 - $1,627,000
2
Beds
2
Baths
1,484
Sq Ft
$977/Sq Ft
Est. Value
About This Home
This home is located at 1742 Grant St, Berkeley, CA 94703 and is currently estimated at $1,449,440, approximately $976 per square foot. 1742 Grant St is a home located in Alameda County with nearby schools including Berkeley Arts Magnet at Whittier School, Washington Elementary School, and Oxford Elementary School.
Ownership History
Date
Name
Owned For
Owner Type
Purchase Details
Closed on
Sep 6, 2011
Sold by
Freedman Julie E
Bought by
Freedman Julie E and Julie E Freedman Revocable Tru
Current Estimated Value
Purchase Details
Closed on
Nov 1, 2010
Sold by
Briley Suzanne
Bought by
Freedman Julie E
Home Financials for this Owner
Home Financials are based on the most recent Mortgage that was taken out on this home.
Original Mortgage
$417,000
Outstanding Balance
$275,971
Interest Rate
4.33%
Mortgage Type
New Conventional
Estimated Equity
$1,173,469
Purchase Details
Closed on
May 16, 2000
Sold by
Wangeman Matthew J and Wangeman Mark C
Bought by
Briley Suzanne
Purchase Details
Closed on
Nov 5, 1998
Sold by
Grantham Robert W Trust and Leslie G
Bought by
Wangeman Matthew J and Wangeman Mark C
Home Financials for this Owner
Home Financials are based on the most recent Mortgage that was taken out on this home.
Original Mortgage
$150,000
Interest Rate
6.54%
Create a Home Valuation Report for This Property
The Home Valuation Report is an in-depth analysis detailing your home's value as well as a comparison with similar homes in the area
Home Values in the Area
Average Home Value in this Area
Purchase History
| Date | Buyer | Sale Price | Title Company |
|---|---|---|---|
| Freedman Julie E | -- | None Available | |
| Freedman Julie E | $700,000 | Placer Title Company | |
| Briley Suzanne | $487,000 | First American Title | |
| Wangeman Matthew J | $325,000 | -- |
Source: Public Records
Mortgage History
| Date | Status | Borrower | Loan Amount |
|---|---|---|---|
| Open | Freedman Julie E | $417,000 | |
| Previous Owner | Wangeman Matthew J | $150,000 |
Source: Public Records
Tax History
| Year | Tax Paid | Tax Assessment Tax Assessment Total Assessment is a certain percentage of the fair market value that is determined by local assessors to be the total taxable value of land and additions on the property. | Land | Improvement |
|---|---|---|---|---|
| 2025 | $13,385 | $889,770 | $269,031 | $627,739 |
| 2024 | $13,385 | $872,192 | $263,757 | $615,435 |
| 2023 | $13,109 | $861,958 | $258,587 | $603,371 |
| 2022 | $12,880 | $838,060 | $253,518 | $591,542 |
| 2021 | $12,915 | $821,491 | $248,547 | $579,944 |
| 2020 | $12,236 | $820,000 | $246,000 | $574,000 |
| 2019 | $11,772 | $803,928 | $241,178 | $562,750 |
| 2018 | $11,578 | $788,171 | $236,451 | $551,720 |
| 2017 | $11,180 | $772,722 | $231,816 | $540,906 |
| 2016 | $10,833 | $757,574 | $227,272 | $530,302 |
| 2015 | $10,690 | $746,200 | $223,860 | $522,340 |
| 2014 | $10,620 | $731,583 | $219,475 | $512,108 |
Source: Public Records
Map
Nearby Homes
- 1716 Hearst Ave
- 1625 Martin Luther King jr Way
- 1732 University Ave
- 2015 Hearst Ave
- 1609 Bonita Ave Unit 5
- 2112 Mckinley Ave Unit D
- 1610 Milvia St
- 2218 -2222 Grant St
- 2035 Francisco St
- 1841 Vine St
- 1425 Martin Luther King jr Way
- 1425 Virginia St
- 1578 Allston Way
- 1682 Oxford St
- 1718 Bancroft Way
- 1408 Henry St
- 2201 Virginia St Unit 2
- 1734 Spruce St
- 1360 Berkeley Way
- 1739 Spruce St
- 1740 Grant St
- 1751 Delaware St
- 1749 Delaware St
- 1745 Delaware St
- 1732 Grant St
- 1743 Delaware St
- 1726 Grant St
- 1801 Delaware St
- 1739 Delaware St
- 1734 Francisco St
- 1738 Francisco St
- 1805 Delaware St
- 1732 Francisco St
- 1732 Francisco St Unit 1732A
- 1800 Grant St
- 1733 Grant St
- 1737 Grant St
- 1746 Francisco St
- 1735 Delaware St
- 1809 Delaware St
Your Personal Tour Guide
Ask me questions while you tour the home.