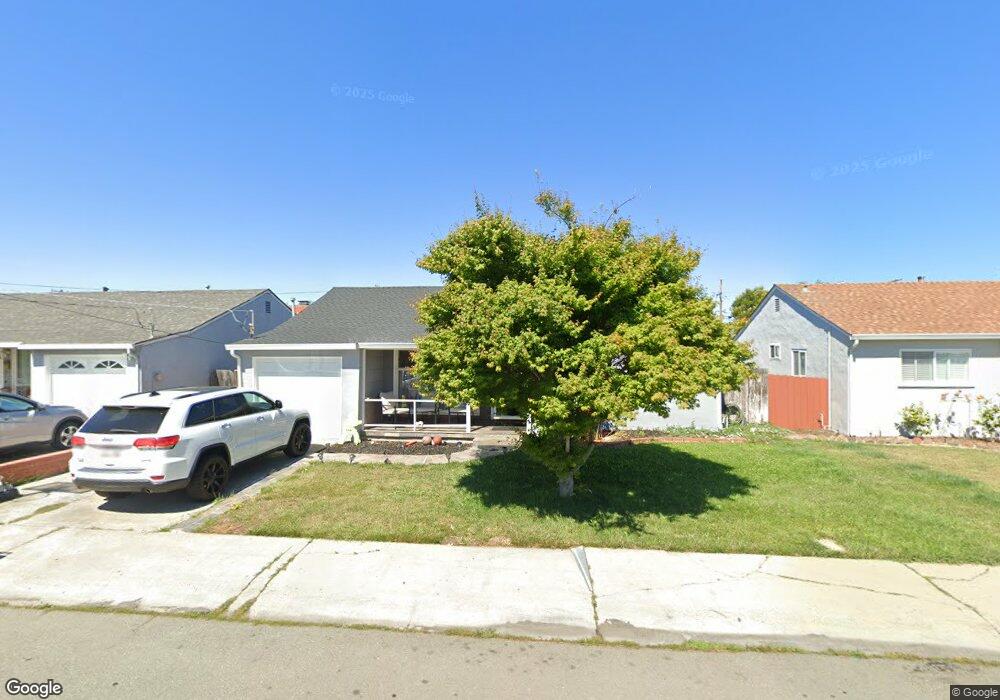
17423 Via Julia San Lorenzo, CA 94580
Estimated Value: $657,000 - $792,567
3
Beds
1
Bath
1,031
Sq Ft
$710/Sq Ft
Est. Value
About This Home
This home is located at 17423 Via Julia, San Lorenzo, CA 94580 and is currently estimated at $732,142, approximately $710 per square foot. 17423 Via Julia is a home located in Alameda County with nearby schools including Del Rey Elementary School, Bohannon Middle School, and Arroyo High School.
Ownership History
Date
Name
Owned For
Owner Type
Purchase Details
Closed on
Feb 8, 2008
Sold by
Berg Carolyn Ann
Bought by
Valenzuela Joseph Ray and Valenzuela Victoria C
Current Estimated Value
Home Financials for this Owner
Home Financials are based on the most recent Mortgage that was taken out on this home.
Original Mortgage
$231,000
Outstanding Balance
$145,250
Interest Rate
6%
Mortgage Type
Purchase Money Mortgage
Estimated Equity
$586,892
Purchase Details
Closed on
Dec 21, 2007
Sold by
Clot Cynthia Marie and Ernest R Fraga 1996 Trust
Bought by
Berg Carolyn Ann
Home Financials for this Owner
Home Financials are based on the most recent Mortgage that was taken out on this home.
Original Mortgage
$231,000
Outstanding Balance
$145,250
Interest Rate
6%
Mortgage Type
Purchase Money Mortgage
Estimated Equity
$586,892
Purchase Details
Closed on
Aug 30, 1996
Sold by
Raulin Fraga Ernest R and Raulin Ernest
Bought by
Fraga Ernest R and Irrevocable Ernest R Fraga 199
Purchase Details
Closed on
Feb 5, 1996
Sold by
Berg Timothy
Bought by
Berg Carolyn Ann
Create a Home Valuation Report for This Property
The Home Valuation Report is an in-depth analysis detailing your home's value as well as a comparison with similar homes in the area
Home Values in the Area
Average Home Value in this Area
Purchase History
| Date | Buyer | Sale Price | Title Company |
|---|---|---|---|
| Valenzuela Joseph Ray | $330,000 | Old Republic Title Company | |
| Berg Carolyn Ann | $330,000 | North American Title Company | |
| Fraga Ernest R | -- | -- | |
| Fraga Ernest R | -- | -- | |
| Berg Carolyn Ann | -- | -- | |
| Fraga Ernest Raulin | -- | -- |
Source: Public Records
Mortgage History
| Date | Status | Borrower | Loan Amount |
|---|---|---|---|
| Open | Valenzuela Joseph Ray | $231,000 |
Source: Public Records
Tax History Compared to Growth
Tax History
| Year | Tax Paid | Tax Assessment Tax Assessment Total Assessment is a certain percentage of the fair market value that is determined by local assessors to be the total taxable value of land and additions on the property. | Land | Improvement |
|---|---|---|---|---|
| 2025 | $5,796 | $429,712 | $130,029 | $306,683 |
| 2024 | $5,796 | $421,150 | $127,480 | $300,670 |
| 2023 | $5,772 | $419,758 | $124,981 | $294,777 |
| 2022 | $5,681 | $404,529 | $122,531 | $288,998 |
| 2021 | $5,523 | $396,462 | $120,129 | $283,333 |
| 2020 | $5,400 | $399,326 | $118,898 | $280,428 |
| 2019 | $5,366 | $388,557 | $116,567 | $271,990 |
| 2018 | $5,054 | $380,941 | $114,282 | $266,659 |
| 2017 | $4,824 | $373,473 | $112,042 | $261,431 |
| 2016 | $4,601 | $366,151 | $109,845 | $256,306 |
| 2015 | $4,500 | $360,653 | $108,196 | $252,457 |
| 2014 | $4,432 | $353,591 | $106,077 | $247,514 |
Source: Public Records
Map
Nearby Homes
- 1867 Via Buena Vista
- 17354 Via el Cerrito
- 1608 Keller Ave
- 1766 Via Redondo
- 1575 Via Lucas
- 1311 Via Manzanas
- 18005 Sunol Rd
- 1631 Via Ventana
- 18003 Incline Place
- 1655 Via Escondido
- 18018 Sahara Rd
- 819 Bockman Rd
- 17316 Via Flores
- 16050 Via Olinda
- 17347 Via Encinas
- 18251 Via Jose
- 1781 Via Rancho
- 17761 Via Arriba
- 0 E 14th St Unit 41059501
- 16011 Via Conejo
- 17415 Via Julia
- 17431 Via Julia
- 17418 Via Melina
- 17439 Via Julia
- 17426 Via Melina
- 17410 Via Melina
- 17407 Via Julia
- 1788 Via Buena Vista
- 17434 Via Melina
- 17422 Via Julia
- 17414 Via Julia
- 17430 Via Julia
- 17402 Via Melina
- 17447 Via Julia
- 17406 Via Julia
- 17438 Via Julia
- 17442 Via Melina
- 17455 Via Julia
- 17446 Via Julia
- 1738 Via Buena Vista