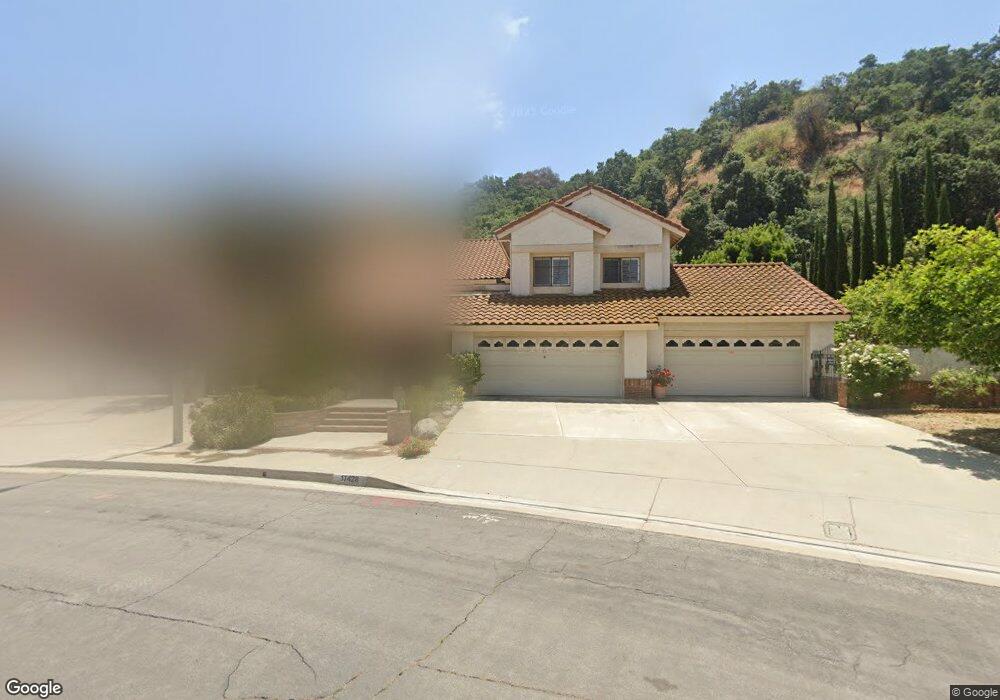
17428 Pamela Ct Rowland Heights, CA 91748
Estimated Value: $1,647,079 - $1,872,000
4
Beds
3
Baths
3,946
Sq Ft
$440/Sq Ft
Est. Value
About This Home
This home is located at 17428 Pamela Ct, Rowland Heights, CA 91748 and is currently estimated at $1,735,770, approximately $439 per square foot. 17428 Pamela Ct is a home located in Los Angeles County with nearby schools including Alvarado Intermediate School, John A. Rowland High School, and Southlands Christian Schools.
Ownership History
Date
Name
Owned For
Owner Type
Purchase Details
Closed on
Nov 6, 2009
Sold by
Chen Warren and Chen Joyce
Bought by
Chen James Larry
Current Estimated Value
Home Financials for this Owner
Home Financials are based on the most recent Mortgage that was taken out on this home.
Original Mortgage
$516,000
Outstanding Balance
$334,681
Interest Rate
4.87%
Mortgage Type
New Conventional
Estimated Equity
$1,401,089
Purchase Details
Closed on
Mar 13, 2001
Sold by
Chen Hui Hua
Bought by
Chen Wun Jieh and Chen Hui Hua
Purchase Details
Closed on
Aug 25, 1998
Sold by
Kim Joseph and Kim Lisa B
Bought by
Chen Hui Hua
Home Financials for this Owner
Home Financials are based on the most recent Mortgage that was taken out on this home.
Original Mortgage
$300,000
Interest Rate
6.79%
Purchase Details
Closed on
May 12, 1994
Sold by
Behrens John A
Bought by
Kim Joseph and Kim Lisa B
Home Financials for this Owner
Home Financials are based on the most recent Mortgage that was taken out on this home.
Original Mortgage
$408,000
Interest Rate
8.53%
Create a Home Valuation Report for This Property
The Home Valuation Report is an in-depth analysis detailing your home's value as well as a comparison with similar homes in the area
Home Values in the Area
Average Home Value in this Area
Purchase History
| Date | Buyer | Sale Price | Title Company |
|---|---|---|---|
| Chen James Larry | $860,000 | California Counties Title Co | |
| Chen James Larry | -- | California Counties Title Co | |
| Chen Wun Jieh | -- | -- | |
| Chen Hui Hua | $520,000 | Chicago Title Co | |
| Chen Hui Hua | -- | Chicago Title Co | |
| Kim Joseph | $510,000 | Investors Title Company |
Source: Public Records
Mortgage History
| Date | Status | Borrower | Loan Amount |
|---|---|---|---|
| Open | Chen James Larry | $516,000 | |
| Previous Owner | Chen Hui Hua | $300,000 | |
| Previous Owner | Kim Joseph | $408,000 |
Source: Public Records
Tax History Compared to Growth
Tax History
| Year | Tax Paid | Tax Assessment Tax Assessment Total Assessment is a certain percentage of the fair market value that is determined by local assessors to be the total taxable value of land and additions on the property. | Land | Improvement |
|---|---|---|---|---|
| 2025 | $13,808 | $1,110,094 | $347,096 | $762,998 |
| 2024 | $13,808 | $1,088,329 | $340,291 | $748,038 |
| 2023 | $13,243 | $1,066,990 | $333,619 | $733,371 |
| 2022 | $12,957 | $1,046,070 | $327,078 | $718,992 |
| 2021 | $12,738 | $1,025,560 | $320,665 | $704,895 |
| 2019 | $12,352 | $995,143 | $311,154 | $683,989 |
| 2018 | $11,780 | $975,631 | $305,053 | $670,578 |
| 2016 | $11,322 | $937,748 | $293,208 | $644,540 |
| 2015 | $11,133 | $923,663 | $288,804 | $634,859 |
| 2014 | $11,109 | $905,570 | $283,147 | $622,423 |
Source: Public Records
Map
Nearby Homes
- 17712 Nearbank Dr
- 2503 Donosa Dr
- 2330 Donosa Dr
- 2048 Calle Bogota
- 1948 Calle Bogota
- 17834 Calle Los Arboles
- 17070 Colima Rd Unit 284
- 18220 Gallineta St
- 2521 Mountainview Ct
- 16978 Colchester Way Unit 140
- 0 Airoso Rd
- 18239 Villa Clara St
- 2367 Mountain Brook Dr
- 18109 Graystone Way
- 2426 Batson Ave
- 18131 Camino Bello Unit 4
- 18138 Via Amorosa Unit 4
- 1804 Ewing Ct
- 2240 Valle Dr
- 18225 Camino Bello Unit 4
- 17434 Pamela Ct
- 17418 Pamela Ct
- 17408 Pamela Ct
- 17419 Pamela Ct
- 2333 Saleroso Dr
- 17441 Pamela Ct
- 2341 Saleroso Dr
- 17404 Pamela Ct
- 17410 Seco Ct
- 2349 Saleroso Dr
- 17404 Seco Ct
- 17403 Pamela Ct
- 17400 Pamela Ct
- 2328 Saleroso Dr
- 2355 Saleroso Dr
- 2383 Remora Dr
- 2316 Saleroso Dr
- 17400 Seco Ct
- 2371 Remora Dr
- 2405 Saleroso Dr