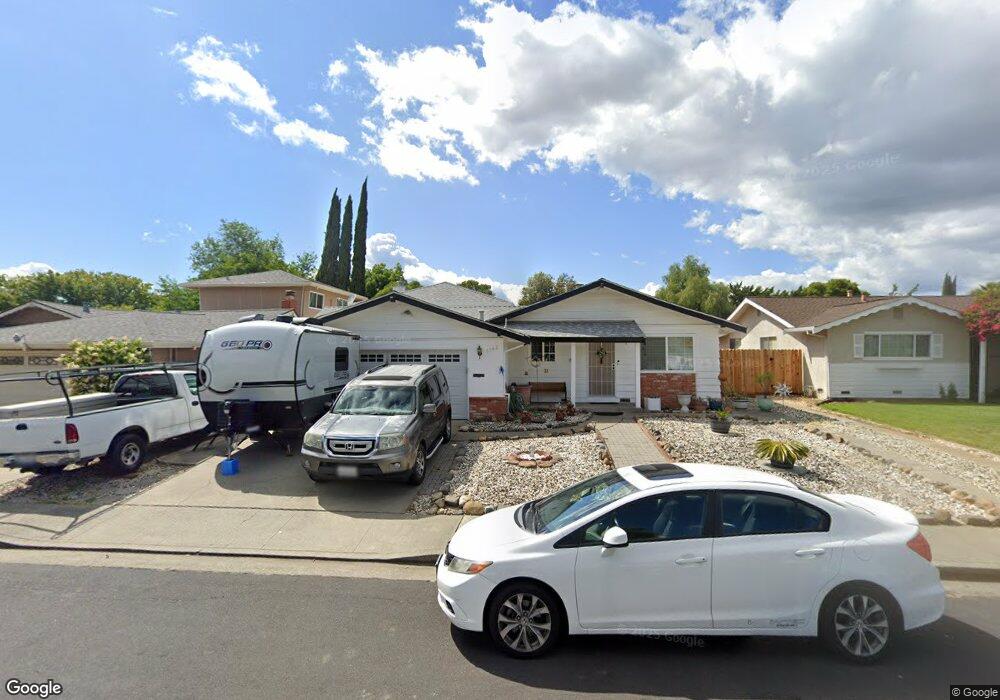
1743 Alford Dr Fairfield, CA 94534
Estimated Value: $531,000 - $590,000
3
Beds
2
Baths
1,714
Sq Ft
$328/Sq Ft
Est. Value
About This Home
This home is located at 1743 Alford Dr, Fairfield, CA 94534 and is currently estimated at $561,913, approximately $327 per square foot. 1743 Alford Dr is a home located in Solano County with nearby schools including K. I. Jones Elementary School, Angelo Rodriguez High School, and Solano Christian Academy.
Ownership History
Date
Name
Owned For
Owner Type
Purchase Details
Closed on
Aug 26, 2019
Sold by
Huaco Helen
Bought by
Huaco John
Current Estimated Value
Home Financials for this Owner
Home Financials are based on the most recent Mortgage that was taken out on this home.
Original Mortgage
$394,383
Outstanding Balance
$345,449
Interest Rate
3.6%
Mortgage Type
FHA
Estimated Equity
$216,464
Purchase Details
Closed on
Sep 12, 2013
Sold by
Ness Oreland D and Ness Ursula
Bought by
Huaco John
Home Financials for this Owner
Home Financials are based on the most recent Mortgage that was taken out on this home.
Original Mortgage
$284,747
Interest Rate
4.87%
Mortgage Type
FHA
Create a Home Valuation Report for This Property
The Home Valuation Report is an in-depth analysis detailing your home's value as well as a comparison with similar homes in the area
Purchase History
| Date | Buyer | Sale Price | Title Company |
|---|---|---|---|
| Huaco John | -- | Unisource Title | |
| Huaco John | -- | Unisource | |
| Huaco John | $290,000 | Fidelity National Title Co |
Source: Public Records
Mortgage History
| Date | Status | Borrower | Loan Amount |
|---|---|---|---|
| Open | Huaco John | $394,383 | |
| Closed | Huaco John | $284,747 |
Source: Public Records
Tax History
| Year | Tax Paid | Tax Assessment Tax Assessment Total Assessment is a certain percentage of the fair market value that is determined by local assessors to be the total taxable value of land and additions on the property. | Land | Improvement |
|---|---|---|---|---|
| 2025 | $3,979 | $355,490 | $30,641 | $324,849 |
| 2024 | $3,979 | $348,521 | $30,041 | $318,480 |
| 2023 | $3,857 | $341,688 | $29,452 | $312,236 |
| 2022 | $3,810 | $334,989 | $28,875 | $306,114 |
| 2021 | $3,773 | $328,421 | $28,309 | $300,112 |
| 2020 | $3,685 | $325,054 | $28,019 | $297,035 |
| 2019 | $3,594 | $318,681 | $27,470 | $291,211 |
| 2018 | $3,710 | $312,433 | $26,932 | $285,501 |
| 2017 | $3,539 | $306,307 | $26,404 | $279,903 |
| 2016 | $3,511 | $300,302 | $25,887 | $274,415 |
| 2015 | $3,278 | $295,793 | $25,499 | $270,294 |
| 2014 | $3,248 | $290,000 | $25,000 | $265,000 |
Source: Public Records
Map
Nearby Homes
- 1858 Barbour Dr
- 2630 Owens St
- 2051 Barbour Dr
- 2635 Alvarado Ct Unit 3
- 2848 Howe Ct
- 2810 Miller Ct
- 1300 Sunningdale Ln
- 1308 Sunningdale Ln
- 2903 Burbank Dr
- 1301 Sunningdale Ln
- Bryce Plan at Brighton Place
- Cora Plan at Brighton Place
- 58 Del Prado Cir
- 2795 Vista Palomar None
- 2795 Vista Palomar
- 160 Sutherlin Ln
- 2034 Cambridge Dr
- 2472 Vista Grande
- 2219 Nottingham Dr
- 1318 Cleveland St
- 1749 Alford Dr
- 1755 Alford Dr
- 1731 Alford Dr
- 1972 Barbour Dr
- 1966 Barbour Dr
- 1978 Barbour Dr
- 1754 Alford Dr
- 1960 Barbour Dr
- 1760 Alford Dr
- 1761 Alford Dr
- 1748 Alford Dr
- 1984 Barbour Dr
- 1725 Alford Dr
- 1766 Alford Dr
- 1742 Alford Dr
- 2560 Alford Ct
- 1772 Alford Dr
- 2570 Alford Ct
- 1954 Barbour Dr
- 1990 Barbour Dr