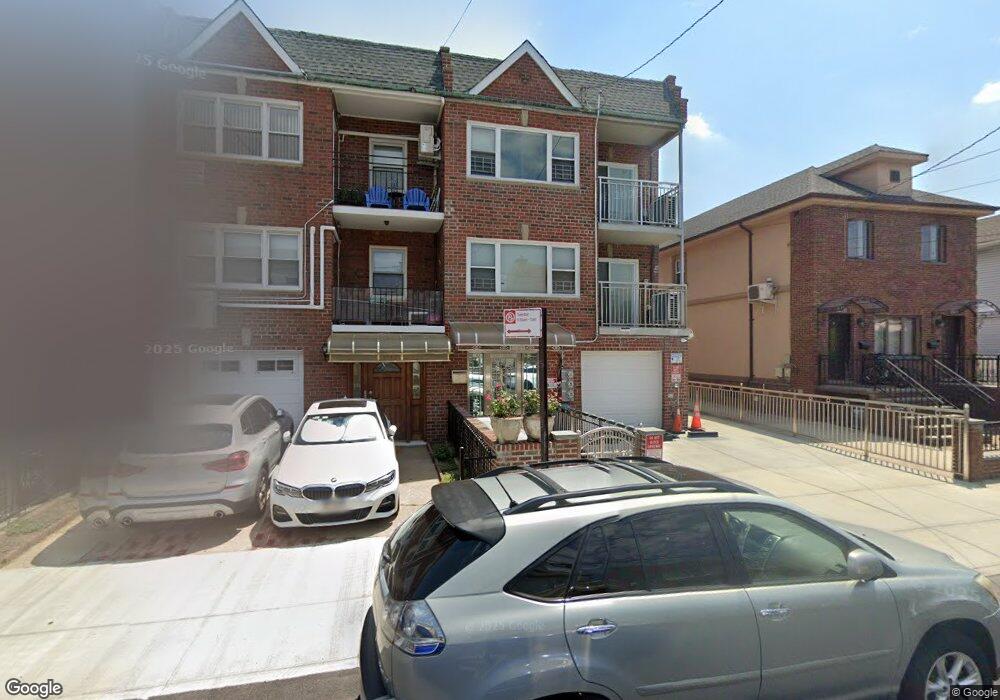
1743 W 12th St Brooklyn, NY 11223
Gravesend NeighborhoodEstimated Value: $837,122 - $2,211,000
Studio
--
Bath
3,490
Sq Ft
$475/Sq Ft
Est. Value
About This Home
This home is located at 1743 W 12th St, Brooklyn, NY 11223 and is currently estimated at $1,656,281, approximately $474 per square foot. 1743 W 12th St is a home located in Kings County with nearby schools including P.S. 97 - The Highlawn, Seth Low Intermediate School 96, and James Madison High School.
Ownership History
Date
Name
Owned For
Owner Type
Purchase Details
Closed on
Nov 15, 2017
Sold by
He Alvin and Li Jerry
Bought by
Li Jerry
Current Estimated Value
Home Financials for this Owner
Home Financials are based on the most recent Mortgage that was taken out on this home.
Original Mortgage
$641,633
Outstanding Balance
$538,084
Interest Rate
3.88%
Mortgage Type
Purchase Money Mortgage
Estimated Equity
$1,118,197
Purchase Details
Closed on
Sep 18, 2016
Sold by
He Alvin and Li Kerry
Bought by
He Alvin and Li Jerry
Purchase Details
Closed on
May 2, 2011
Sold by
Li Wan Fen and Li Wei Hai
Bought by
Li Kerry
Purchase Details
Closed on
May 10, 2010
Sold by
He Wan Bing Xu
Bought by
He Alvin
Purchase Details
Closed on
Mar 20, 1996
Sold by
Dagostino Girolamo and Dagostino Gilda
Bought by
Li Wei Hai and Li Wan Fen
Home Financials for this Owner
Home Financials are based on the most recent Mortgage that was taken out on this home.
Original Mortgage
$194,000
Interest Rate
6.9%
Create a Home Valuation Report for This Property
The Home Valuation Report is an in-depth analysis detailing your home's value as well as a comparison with similar homes in the area
Home Values in the Area
Average Home Value in this Area
Purchase History
| Date | Buyer | Sale Price | Title Company |
|---|---|---|---|
| Li Jerry | $660,000 | -- | |
| He Alvin | -- | -- | |
| Li Kerry | -- | -- | |
| He Alvin | -- | -- | |
| Li Wei Hai | $278,000 | -- |
Source: Public Records
Mortgage History
| Date | Status | Borrower | Loan Amount |
|---|---|---|---|
| Open | Li Jerry | $641,633 | |
| Previous Owner | Li Wei Hai | $194,000 |
Source: Public Records
Tax History
| Year | Tax Paid | Tax Assessment Tax Assessment Total Assessment is a certain percentage of the fair market value that is determined by local assessors to be the total taxable value of land and additions on the property. | Land | Improvement |
|---|---|---|---|---|
| 2025 | $12,375 | $93,000 | $16,440 | $76,560 |
| 2024 | $12,375 | $91,260 | $16,440 | $74,820 |
| 2023 | $11,805 | $101,040 | $16,440 | $84,600 |
| 2022 | $11,127 | $84,540 | $16,440 | $68,100 |
| 2021 | $11,688 | $65,280 | $16,440 | $48,840 |
| 2020 | $5,693 | $72,180 | $16,440 | $55,740 |
| 2019 | $10,740 | $72,180 | $16,440 | $55,740 |
| 2018 | $9,874 | $48,438 | $11,714 | $36,724 |
| 2017 | $9,169 | $46,448 | $11,570 | $34,878 |
| 2016 | $8,942 | $46,281 | $12,324 | $33,957 |
| 2015 | $5,285 | $45,352 | $13,912 | $31,440 |
| 2014 | $5,285 | $42,786 | $15,747 | $27,039 |
Source: Public Records
Map
Nearby Homes
- 74 Quentin Rd
- 1720 W 12th St
- 1708 W 12th St
- 44 Quentin Rd
- 226 Kings Hwy
- 1739 W 9th St
- 1651 W 11th St
- 1645 W 11th St
- 104 Highlawn Ave
- 2339 80th St
- 2282 78th St
- 1642 W 9th St Unit 3B
- 2276 78th St
- 2265 78th St
- 1639 W 9th St
- 1652 W 8th St
- 2347 81st St
- 1838 W 13th St Unit 3B
- 1838 W 13th St
- 80 Avenue P Unit D14
Your Personal Tour Guide
Ask me questions while you tour the home.