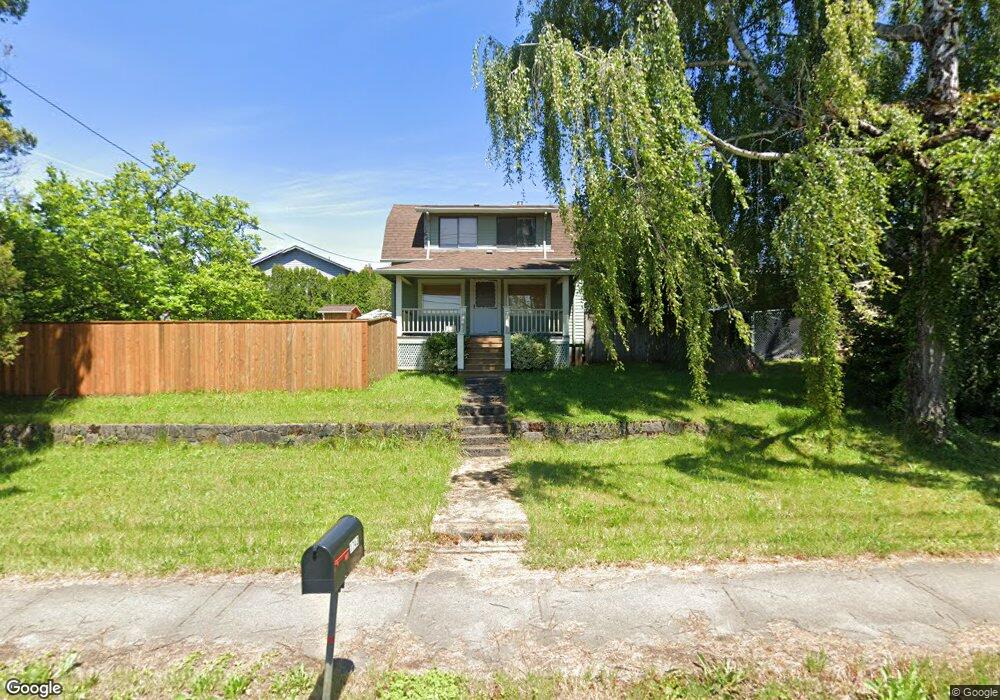
1743 W Powell Blvd Gresham, OR 97030
Northwest Gresham NeighborhoodEstimated Value: $435,971 - $618,000
3
Beds
2
Baths
1,472
Sq Ft
$335/Sq Ft
Est. Value
About This Home
This home is located at 1743 W Powell Blvd, Gresham, OR 97030 and is currently estimated at $492,743, approximately $334 per square foot. 1743 W Powell Blvd is a home located in Multnomah County with nearby schools including Dexter McCarty Middle School, Gresham High School, and Gresham Arthur Academy.
Ownership History
Date
Name
Owned For
Owner Type
Purchase Details
Closed on
Jan 25, 1999
Sold by
Jensen Blake and Jensen Blake E
Bought by
Jensen Blake and Odell Tiffaney
Current Estimated Value
Home Financials for this Owner
Home Financials are based on the most recent Mortgage that was taken out on this home.
Original Mortgage
$120,800
Outstanding Balance
$27,085
Interest Rate
6.63%
Mortgage Type
Purchase Money Mortgage
Estimated Equity
$465,658
Purchase Details
Closed on
Mar 20, 1996
Sold by
Jensen Blake E
Bought by
Jensen Blake and Wilken Paul D
Home Financials for this Owner
Home Financials are based on the most recent Mortgage that was taken out on this home.
Original Mortgage
$100,000
Interest Rate
7.05%
Mortgage Type
Balloon
Purchase Details
Closed on
Jan 26, 1995
Sold by
Bennett James L
Bought by
Jensen Blake E and Wilken Paul D
Home Financials for this Owner
Home Financials are based on the most recent Mortgage that was taken out on this home.
Original Mortgage
$97,751
Interest Rate
9.28%
Mortgage Type
FHA
Create a Home Valuation Report for This Property
The Home Valuation Report is an in-depth analysis detailing your home's value as well as a comparison with similar homes in the area
Home Values in the Area
Average Home Value in this Area
Purchase History
| Date | Buyer | Sale Price | Title Company |
|---|---|---|---|
| Jensen Blake | -- | Transnation Title Insurance | |
| Jensen Blake | -- | Stewart Title | |
| Jensen Blake E | $98,450 | Ticor Title Insurance |
Source: Public Records
Mortgage History
| Date | Status | Borrower | Loan Amount |
|---|---|---|---|
| Open | Jensen Blake | $120,800 | |
| Closed | Jensen Blake | $100,000 | |
| Closed | Jensen Blake E | $97,751 |
Source: Public Records
Tax History
| Year | Tax Paid | Tax Assessment Tax Assessment Total Assessment is a certain percentage of the fair market value that is determined by local assessors to be the total taxable value of land and additions on the property. | Land | Improvement |
|---|---|---|---|---|
| 2025 | $4,919 | $241,720 | -- | -- |
| 2024 | $4,709 | $234,680 | -- | -- |
| 2023 | $4,709 | $227,850 | -- | -- |
| 2022 | $4,170 | $221,220 | $0 | $0 |
| 2021 | $4,065 | $214,780 | $0 | $0 |
| 2020 | $3,825 | $208,530 | $0 | $0 |
| 2019 | $3,725 | $202,460 | $0 | $0 |
| 2018 | $3,552 | $196,570 | $0 | $0 |
| 2017 | $3,408 | $190,850 | $0 | $0 |
| 2016 | $3,004 | $185,300 | $0 | $0 |
| 2015 | $2,940 | $179,910 | $0 | $0 |
| 2014 | $2,868 | $174,670 | $0 | $0 |
Source: Public Records
Map
Nearby Homes
- 44 SW Birdsdale Dr
- 2095 NW 3rd St
- 230 NW Mawrcrest Ave
- 236 NW Mawrcrest Ave
- 256 NW Mawrcrest Ave
- 1113 W Powell Blvd
- 284 NW Mawrcrest Ave
- 63 NW Mawrcrest Ave
- 21 NW Mawrcrest Ave
- 85 NW Mawrcrest Ave
- 181 NW Mawrcrest Ave
- 185 NW Mawrcrest Ave
- 765 NW Angeline Ave
- 1745 NW 7th Place
- 159 SW Florence Ave Unit 64
- 159 SW Florence Ave
- 2543 NW 2nd Terrace
- 2590 NW 2nd Terrace
- 1325 NW 9th St
- 970 NW Wonderview Ct Unit 980
- 10 NW Bella Vista Ave
- 16 NW Bella Vista Ave
- 1715 W Powell Blvd Unit 1717
- 27 NW Orchard Place
- 33 NW Orchard Place
- 28 NW Bella Vista Ave
- 15 NW Bella Vista Ave
- 20 SW Willowbrook Place
- 40 SW Willowbrook Place
- 45 NW Bella Vista Ave
- 1643 W Powell Blvd Unit 1645
- 45 NW Orchard Place
- 22 NW Orchard Place
- 25 SW Willowbrook Place
- 75 NW Bella Vista Ave
- 25 NW Bella Vista Ave
- 50 SW Willowbrook Place
- 34 NW Orchard Place
- 46 NW Bella Vista Ave
- 51 NW Orchard Place
Your Personal Tour Guide
Ask me questions while you tour the home.