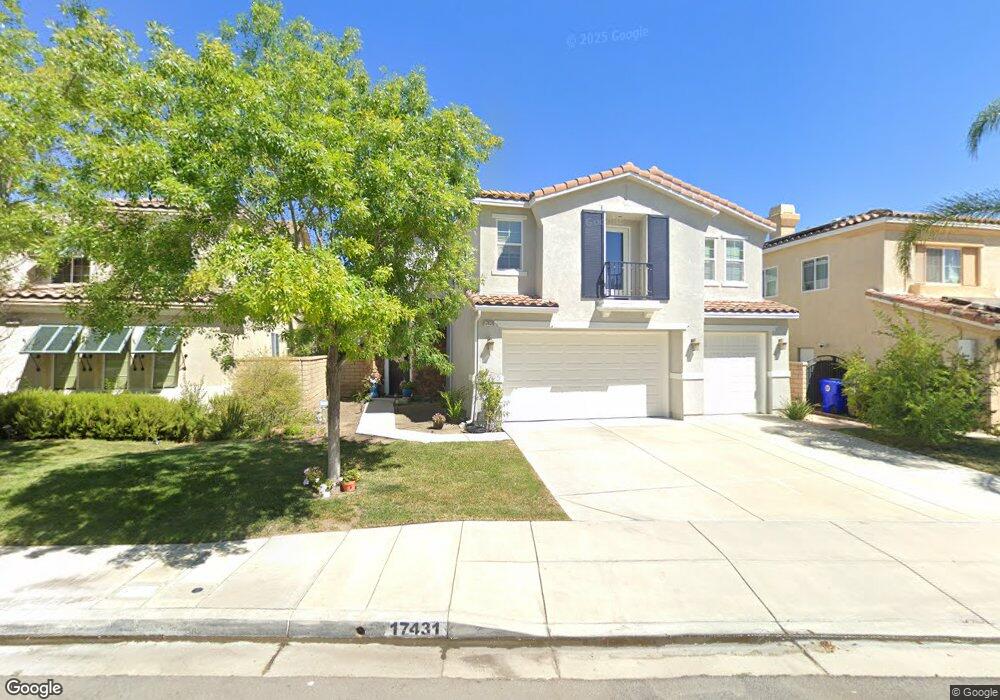
17431 Honey Maple St Canyon Country, CA 91387
Estimated Value: $985,175 - $1,223,000
5
Beds
4
Baths
3,446
Sq Ft
$318/Sq Ft
Est. Value
About This Home
This home is located at 17431 Honey Maple St, Canyon Country, CA 91387 and is currently estimated at $1,094,544, approximately $317 per square foot. 17431 Honey Maple St is a home located in Los Angeles County with nearby schools including Fair Oaks Ranch Community, La Mesa Junior High School, and Golden Valley High School.
Ownership History
Date
Name
Owned For
Owner Type
Purchase Details
Closed on
Jan 22, 2018
Sold by
Lillenberg Kevin V and Lillenberg Deborah L
Bought by
Lillenberg Kevin Victor and Lillenberg Deborah Lynn
Current Estimated Value
Purchase Details
Closed on
Nov 2, 2010
Sold by
Hsbc Bank Usa National Association
Bought by
Lillenberg Kevin V and Lillenberg Deborah L
Home Financials for this Owner
Home Financials are based on the most recent Mortgage that was taken out on this home.
Original Mortgage
$474,608
Outstanding Balance
$313,510
Interest Rate
4.37%
Mortgage Type
FHA
Estimated Equity
$781,034
Purchase Details
Closed on
Apr 19, 2010
Sold by
Webb Mark and Webb Renate
Bought by
Hsbc Bank Usa National Association
Purchase Details
Closed on
Apr 24, 2007
Sold by
Pardee Homes
Bought by
Webb Mark and Webb Renate
Home Financials for this Owner
Home Financials are based on the most recent Mortgage that was taken out on this home.
Original Mortgage
$627,200
Interest Rate
5.87%
Mortgage Type
Purchase Money Mortgage
Create a Home Valuation Report for This Property
The Home Valuation Report is an in-depth analysis detailing your home's value as well as a comparison with similar homes in the area
Home Values in the Area
Average Home Value in this Area
Purchase History
| Date | Buyer | Sale Price | Title Company |
|---|---|---|---|
| Lillenberg Kevin Victor | -- | None Available | |
| Lillenberg Kevin V | $481,000 | First American Title Company | |
| Hsbc Bank Usa National Association | $490,000 | Accommodation | |
| Webb Mark | $784,000 | Chicago Title |
Source: Public Records
Mortgage History
| Date | Status | Borrower | Loan Amount |
|---|---|---|---|
| Open | Lillenberg Kevin V | $474,608 | |
| Previous Owner | Webb Mark | $627,200 |
Source: Public Records
Tax History Compared to Growth
Tax History
| Year | Tax Paid | Tax Assessment Tax Assessment Total Assessment is a certain percentage of the fair market value that is determined by local assessors to be the total taxable value of land and additions on the property. | Land | Improvement |
|---|---|---|---|---|
| 2025 | $12,416 | $616,230 | $194,090 | $422,140 |
| 2024 | $11,661 | $604,148 | $190,285 | $413,863 |
| 2023 | $11,333 | $592,303 | $186,554 | $405,749 |
| 2022 | $11,079 | $580,691 | $182,897 | $397,794 |
| 2021 | $10,868 | $569,306 | $179,311 | $389,995 |
| 2020 | $10,731 | $563,470 | $177,473 | $385,997 |
| 2019 | $10,461 | $552,423 | $173,994 | $378,429 |
| 2018 | $10,249 | $541,592 | $170,583 | $371,009 |
| 2016 | $9,635 | $520,563 | $163,960 | $356,603 |
| 2015 | $9,966 | $512,745 | $161,498 | $351,247 |
| 2014 | $10,194 | $502,702 | $158,335 | $344,367 |
Source: Public Records
Map
Nearby Homes
- 27060 Mountain Willow Ln
- 27151 Brown Oaks Way
- 17175 Monterey Pines Ln
- 17401 Blue Aspen Ln
- 27323 English Oak Ct
- 17633 Wren Dr
- 17556 Gladesworth Ln
- 27202 Fieldwood Ct
- 27220 Sterling Grove Ln
- 17740 Sweetgum Ln
- 27480 English Ivy Ln
- 27231 Marisa Dr Unit 41
- 18002 Flynn Dr Unit 6208
- 27280 Marisa Dr
- 18024 Flynn Dr Unit 5501
- 18038 Flynn Dr Unit 5304
- 18107 Erik Ct Unit 462
- 27555 Antelope Dr
- 17952 River Cir Unit 3
- 18117 Erik Ct Unit 413
- 17425 Honey Maple St
- 17437 Honey Maple St
- 17419 Honey Maple St
- 17443 Honey Maple St
- 17426 Winter Pine Way
- 17420 Winter Pine Way
- 17432 Winter Pine Way
- 17414 Winter Pine Way
- 17413 Honey Maple St
- 17449 Honey Maple St
- 17438 Winter Pine Way
- 17408 Winter Pine Way
- 17455 Honey Maple St
- 17442 Winter Pine Way
- 17407 Honey Maple St
- 17402 Winter Pine Way
- 17448 Winter Pine Way
- 17461 Honey Maple St
- 17421 Winter Pine Way
- 17427 Winter Pine Way