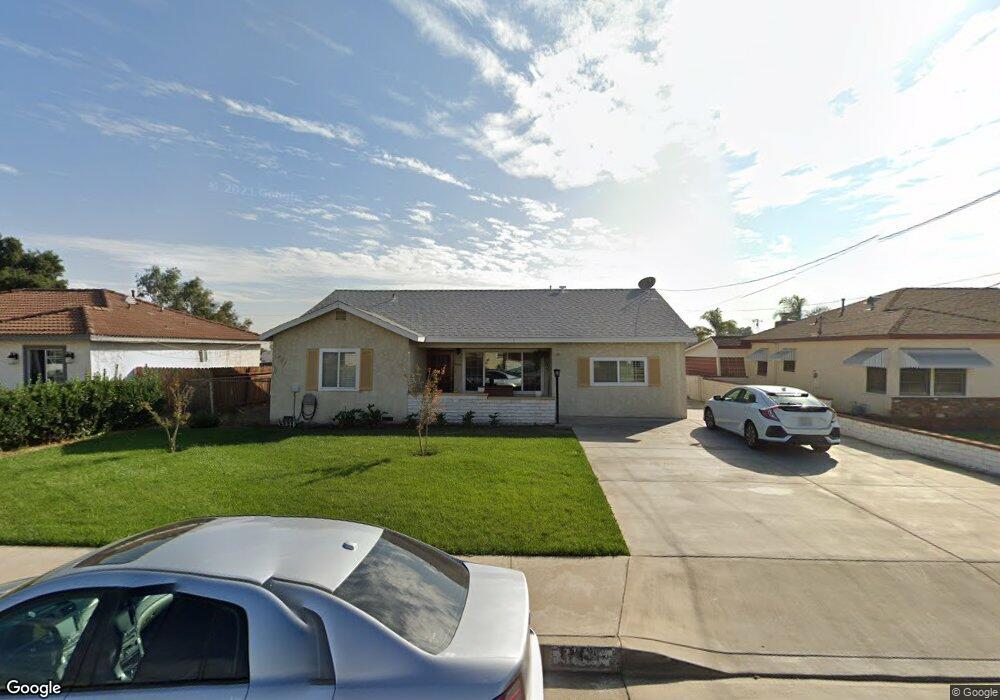
17431 Paine St Fontana, CA 92336
Estimated Value: $579,988 - $739,000
3
Beds
2
Baths
1,959
Sq Ft
$325/Sq Ft
Est. Value
About This Home
This home is located at 17431 Paine St, Fontana, CA 92336 and is currently estimated at $636,497, approximately $324 per square foot. 17431 Paine St is a home located in San Bernardino County with nearby schools including North Tamarind Elementary School, Alder Middle School, and Fontana A. B. Miller High School.
Ownership History
Date
Name
Owned For
Owner Type
Purchase Details
Closed on
Dec 4, 2022
Sold by
Zuniga-Hernandez Ruben and Zuniga-Hernandez Elizabeth
Bought by
Zuniga Elizabeth
Current Estimated Value
Purchase Details
Closed on
Sep 2, 2010
Sold by
Gaxiola Julian Gabriel
Bought by
Zuniga Hernandez Ruben and Zuniga Elizabeth
Home Financials for this Owner
Home Financials are based on the most recent Mortgage that was taken out on this home.
Original Mortgage
$173,794
Interest Rate
4.75%
Mortgage Type
FHA
Purchase Details
Closed on
Apr 11, 2005
Sold by
Raddish Frank A
Bought by
Gaxiola Julian Gabriel and Gaxiola Rachel Linn
Home Financials for this Owner
Home Financials are based on the most recent Mortgage that was taken out on this home.
Original Mortgage
$283,920
Interest Rate
6.25%
Mortgage Type
Fannie Mae Freddie Mac
Create a Home Valuation Report for This Property
The Home Valuation Report is an in-depth analysis detailing your home's value as well as a comparison with similar homes in the area
Home Values in the Area
Average Home Value in this Area
Purchase History
| Date | Buyer | Sale Price | Title Company |
|---|---|---|---|
| Zuniga Elizabeth | -- | Wfg Lender Services | |
| Zuniga Hernandez Ruben | $177,000 | Southland Title Of Burbank | |
| Gaxiola Julian Gabriel | $355,000 | First American |
Source: Public Records
Mortgage History
| Date | Status | Borrower | Loan Amount |
|---|---|---|---|
| Previous Owner | Zuniga Hernandez Ruben | $173,794 | |
| Previous Owner | Gaxiola Julian Gabriel | $283,920 | |
| Closed | Gaxiola Julian Gabriel | $70,980 |
Source: Public Records
Tax History Compared to Growth
Tax History
| Year | Tax Paid | Tax Assessment Tax Assessment Total Assessment is a certain percentage of the fair market value that is determined by local assessors to be the total taxable value of land and additions on the property. | Land | Improvement |
|---|---|---|---|---|
| 2025 | $3,231 | $226,768 | $71,745 | $155,023 |
| 2024 | $3,231 | $222,321 | $70,338 | $151,983 |
| 2023 | $2,705 | $217,962 | $68,959 | $149,003 |
| 2022 | $2,677 | $213,688 | $67,607 | $146,081 |
| 2021 | $2,641 | $209,498 | $66,281 | $143,217 |
| 2020 | $2,621 | $207,349 | $65,601 | $141,748 |
| 2019 | $2,552 | $203,284 | $64,315 | $138,969 |
| 2018 | $2,567 | $199,298 | $63,054 | $136,244 |
| 2017 | $2,529 | $195,391 | $61,818 | $133,573 |
| 2016 | $2,466 | $191,560 | $60,606 | $130,954 |
| 2015 | $2,419 | $188,683 | $59,696 | $128,987 |
| 2014 | $2,407 | $184,987 | $58,527 | $126,460 |
Source: Public Records
Map
Nearby Homes
- 17392 Paine St
- 17562 Court St
- 17548 Court St
- 17196 Barbee St
- 17655 Vine Ct
- 7936 Alder Ave
- 8019 Alder Ave
- 7738 Encinitas Ave
- 17394 Seville Ct
- 17334 Seville Ct
- 7740 Lombardy Ave
- 7760 Blanchard Ave
- 17279 Miller Ave
- 17848 17858 Foothill Blvd
- 17425 Arrow Blvd Unit 8
- 7590 Kempster Ct
- 0 Sierra Ave Unit EV22072866
- 7702 Newport Ct
- 18045 Foothill Blvd
- 17571 Shamrock Ave
- 17421 Paine St
- 17441 Paine St
- 17411 Paine St
- 17451 Paine St
- 17432 Paine St
- 00000 Paine St
- 17461 Paine St
- 17401 Paine St
- 17442 Paine St
- 17422 Paine St
- 17452 Paine St
- 17412 Paine St
- 17393 Paine St
- 17471 Paine St
- 17462 Paine St
- 17402 Paine St
- 17440 Foothill Blvd
- 17472 Paine St
- 17429 Barbee St
- 17481 Paine St