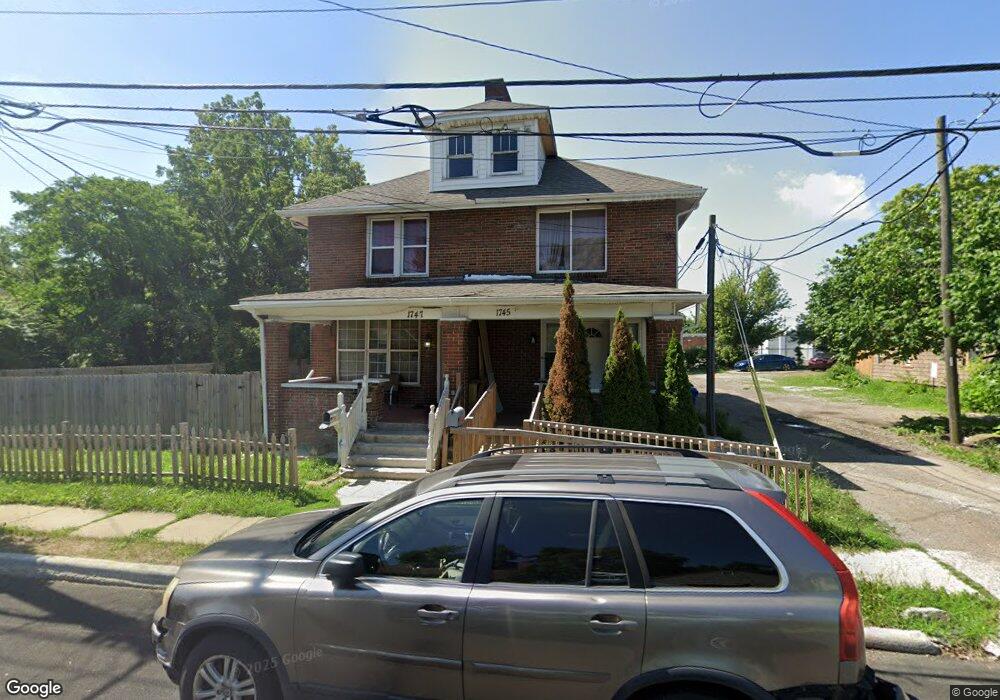
1745 Genessee Ave Unit 747 Columbus, OH 43211
North Linden NeighborhoodEstimated Value: $233,000 - $294,000
7
Beds
3
Baths
3,136
Sq Ft
$83/Sq Ft
Est. Value
About This Home
This home is located at 1745 Genessee Ave Unit 747, Columbus, OH 43211 and is currently estimated at $259,217, approximately $82 per square foot. 1745 Genessee Ave Unit 747 is a home located in Franklin County with nearby schools including Linden STEM Academy (K-6), Linden-Mckinley Stem School On Arcadia, and Focus Learning Academy of Central Columbus.
Ownership History
Date
Name
Owned For
Owner Type
Purchase Details
Closed on
Mar 16, 2018
Sold by
Inacio Jooquin and Feenandes Anarin
Bought by
Jimale Dhihi Abakar and Soleman Abdi Amin
Current Estimated Value
Purchase Details
Closed on
Apr 1, 2017
Sold by
Abdi Abdiaziz and Cruz Stephanie Abb
Bought by
Amonim Abdi Abdiaziz and Amonim Fernandez Inacio Jaoquinn
Purchase Details
Closed on
Nov 28, 2014
Sold by
Christinavera Kathymusic L
Bought by
Cruz Stephanie Ann
Purchase Details
Closed on
May 21, 2014
Sold by
Harbour Portfolio Vi Lp
Bought by
Vera Christina and Music Kathy L
Purchase Details
Closed on
Apr 7, 2011
Sold by
Fannie Mae
Bought by
Harbour Portfolio Vi Lp
Purchase Details
Closed on
Jun 30, 2010
Sold by
Price Rosalyn M and Countrywide Home Loans Inc
Bought by
Fanniemae and Federal National Mortgage Association
Purchase Details
Closed on
Feb 1, 2009
Sold by
Price Roslyn M
Bought by
Jackson Mario M
Home Financials for this Owner
Home Financials are based on the most recent Mortgage that was taken out on this home.
Original Mortgage
$122,400
Interest Rate
8%
Mortgage Type
Seller Take Back
Purchase Details
Closed on
Jan 25, 2006
Sold by
Wilburn Felicia
Bought by
Price Rosalyn M
Home Financials for this Owner
Home Financials are based on the most recent Mortgage that was taken out on this home.
Original Mortgage
$109,600
Interest Rate
6.46%
Mortgage Type
Commercial
Purchase Details
Closed on
Jun 27, 2005
Sold by
Tanner Gregory L
Bought by
Wilburn Felicia
Home Financials for this Owner
Home Financials are based on the most recent Mortgage that was taken out on this home.
Original Mortgage
$90,950
Interest Rate
7.3%
Mortgage Type
Commercial
Purchase Details
Closed on
Sep 25, 2000
Sold by
Hines Wilma G and Hines David
Bought by
Tanner Gregory L
Home Financials for this Owner
Home Financials are based on the most recent Mortgage that was taken out on this home.
Original Mortgage
$82,170
Interest Rate
7.87%
Mortgage Type
Commercial
Purchase Details
Closed on
Dec 30, 1998
Sold by
Hines Wilma G and Hines David
Bought by
Tanner Gregory L
Home Financials for this Owner
Home Financials are based on the most recent Mortgage that was taken out on this home.
Original Mortgage
$52,000
Interest Rate
9%
Mortgage Type
Seller Take Back
Purchase Details
Closed on
May 5, 1992
Bought by
Hines David and Hines Wilma G
Create a Home Valuation Report for This Property
The Home Valuation Report is an in-depth analysis detailing your home's value as well as a comparison with similar homes in the area
Home Values in the Area
Average Home Value in this Area
Purchase History
| Date | Buyer | Sale Price | Title Company |
|---|---|---|---|
| Jimale Dhihi Abakar | $22,000 | None Available | |
| Amonim Abdi Abdiaziz | $47,500 | None Available | |
| Cruz Stephanie Ann | $10,000 | None Available | |
| Vera Christina | $15,500 | None Available | |
| Harbour Portfolio Vi Lp | $5,400 | Attorney | |
| Fanniemae | $28,000 | Attorney | |
| Jackson Mario M | $122,900 | Ticor Title Insurance Co | |
| Price Rosalyn M | $137,000 | Vta Title | |
| Wilburn Felicia | $107,000 | -- | |
| Tanner Gregory L | $52,000 | -- | |
| Tanner Gregory L | $55,000 | Chicago Title West | |
| Hines David | $35,000 | -- |
Source: Public Records
Mortgage History
| Date | Status | Borrower | Loan Amount |
|---|---|---|---|
| Previous Owner | Jackson Mario M | $122,400 | |
| Previous Owner | Price Rosalyn M | $109,600 | |
| Previous Owner | Wilburn Felicia | $90,950 | |
| Previous Owner | Tanner Gregory L | $82,170 | |
| Previous Owner | Tanner Gregory L | $52,000 |
Source: Public Records
Tax History
| Year | Tax Paid | Tax Assessment Tax Assessment Total Assessment is a certain percentage of the fair market value that is determined by local assessors to be the total taxable value of land and additions on the property. | Land | Improvement |
|---|---|---|---|---|
| 2025 | $3,792 | $83,620 | $13,410 | $70,210 |
| 2024 | $3,792 | $83,620 | $13,410 | $70,210 |
| 2023 | $3,895 | $83,620 | $13,410 | $70,210 |
| 2022 | $2,688 | $48,340 | $7,110 | $41,230 |
| 2021 | $2,543 | $48,340 | $7,110 | $41,230 |
| 2020 | $2,696 | $48,340 | $7,110 | $41,230 |
| 2019 | $2,952 | $42,000 | $6,160 | $35,840 |
| 2018 | $3,067 | $42,000 | $6,160 | $35,840 |
| 2017 | $3,182 | $42,010 | $7,110 | $34,900 |
| 2016 | $3,911 | $33,260 | $7,110 | $26,150 |
| 2015 | $3,560 | $33,260 | $7,110 | $26,150 |
| 2014 | $2,686 | $33,260 | $7,110 | $26,150 |
| 2013 | $1,331 | $33,250 | $7,105 | $26,145 |
Source: Public Records
Map
Nearby Homes
- 1326 Minnesota Ave
- 0 Aberdeen Ave Unit 226000728
- 0 Aberdeen Ave Unit 226002456
- 0 Aberdeen Ave Unit 226002459
- 0 Aberdeen Ave Unit 226002457
- 0 Aberdeen Ave Unit 226002458
- 1827 Aberdeen Ave
- 1799 Harold Place
- 1884 Aberdeen Ave
- 1545 Arlington Ave
- 1691 E Weber Rd
- 1544 Briarwood Ave
- 1938 Myrtle Ave
- 1525 Aberdeen Ave
- 2305 Cleveland Ave
- 1591-1593 E Weber Rd
- 1450 Briarwood Ave
- 1509 Loretta Ave
- 2475 Parkwood Ave
- 1864 E Hudson St
- 1745 Genessee Ave
- 1737 Genessee Ave
- 1755 Genessee Ave
- 1767 Genessee Ave
- 1748 Genessee Ave
- 1752 Genessee Ave
- 1744 Genessee Ave
- 1738-1740 Genessee Ave Unit 740
- 1758 Genessee Ave
- 1738 Genessee Ave Unit 740
- 2514 Cleveland Ave
- 2490 Cleveland Ave
- 2546 Cleveland Ave
- 0 Genessee Ave Unit 225001668
- 0 Genessee Ave Unit 2553938
- 0 Genessee Ave Unit 224027897
- 0 Genessee Ave Unit 223023005
- 0 Genessee Ave Unit 223023003
- 0 Genessee Ave Unit 223017548
- 0 Genessee Ave Unit 223012674
Your Personal Tour Guide
Ask me questions while you tour the home.