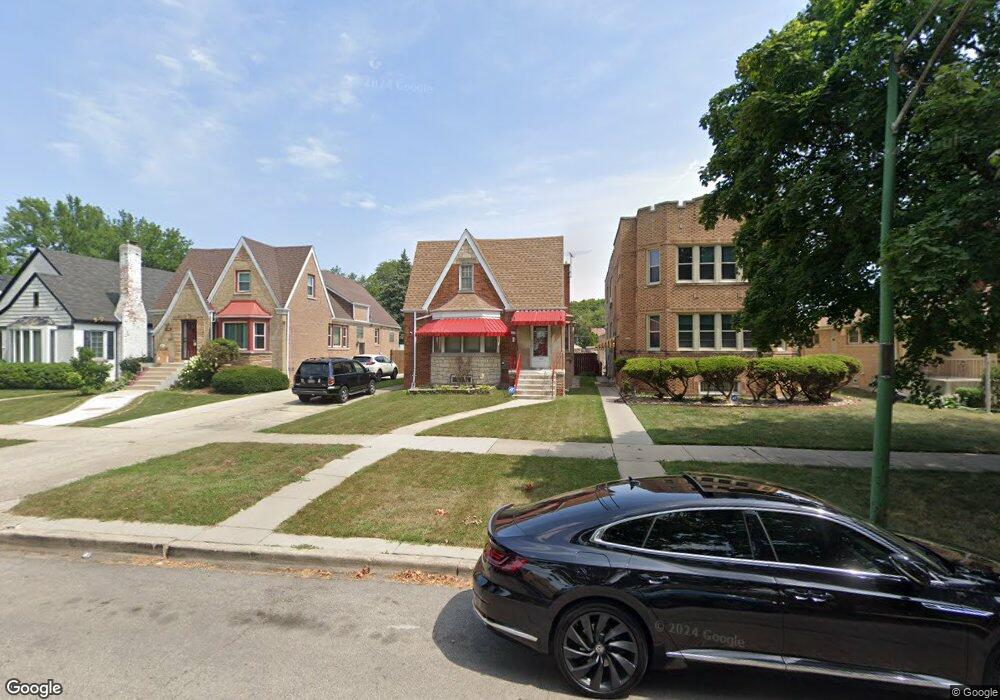
1745 N Neva Ave Chicago, IL 60707
Galewood NeighborhoodEstimated Value: $435,000 - $563,000
5
Beds
2
Baths
2,365
Sq Ft
$211/Sq Ft
Est. Value
About This Home
This home is located at 1745 N Neva Ave, Chicago, IL 60707 and is currently estimated at $498,834, approximately $210 per square foot. 1745 N Neva Ave is a home located in Cook County with nearby schools including Sayre Elementary Language Academy, Steinmetz College Prep, and St Vincent Ferrer Elementary School.
Ownership History
Date
Name
Owned For
Owner Type
Purchase Details
Closed on
Apr 30, 2004
Sold by
Lopez Victor and Lopez Margarita
Bought by
Dunlap Thomas D and Dunlap Robbie A
Current Estimated Value
Home Financials for this Owner
Home Financials are based on the most recent Mortgage that was taken out on this home.
Original Mortgage
$252,000
Outstanding Balance
$119,812
Interest Rate
5.7%
Mortgage Type
Unknown
Estimated Equity
$379,022
Purchase Details
Closed on
Nov 11, 2000
Sold by
Monarrez Marcelina
Bought by
Lopez Victor and Lopez Margarita
Purchase Details
Closed on
Jun 8, 1994
Sold by
Gazdziak Michael N and Gazdziak Donna Marie
Bought by
Lopez Victor and Lopez Margarita
Home Financials for this Owner
Home Financials are based on the most recent Mortgage that was taken out on this home.
Original Mortgage
$129,000
Interest Rate
8.53%
Create a Home Valuation Report for This Property
The Home Valuation Report is an in-depth analysis detailing your home's value as well as a comparison with similar homes in the area
Home Values in the Area
Average Home Value in this Area
Purchase History
| Date | Buyer | Sale Price | Title Company |
|---|---|---|---|
| Dunlap Thomas D | $315,000 | Heritage Title Company | |
| Lopez Victor | -- | -- | |
| Lopez Victor | $180,000 | -- |
Source: Public Records
Mortgage History
| Date | Status | Borrower | Loan Amount |
|---|---|---|---|
| Open | Dunlap Thomas D | $252,000 | |
| Previous Owner | Lopez Victor | $129,000 | |
| Closed | Dunlap Thomas D | $58,000 |
Source: Public Records
Tax History Compared to Growth
Tax History
| Year | Tax Paid | Tax Assessment Tax Assessment Total Assessment is a certain percentage of the fair market value that is determined by local assessors to be the total taxable value of land and additions on the property. | Land | Improvement |
|---|---|---|---|---|
| 2024 | $4,790 | $42,000 | $21,000 | $21,000 |
| 2023 | $4,648 | $26,000 | $13,248 | $12,752 |
| 2022 | $4,648 | $26,000 | $13,248 | $12,752 |
| 2021 | $4,562 | $26,003 | $13,251 | $12,752 |
| 2020 | $6,563 | $32,545 | $8,750 | $23,795 |
| 2019 | $6,662 | $36,568 | $8,750 | $27,818 |
| 2018 | $6,549 | $36,568 | $8,750 | $27,818 |
| 2017 | $5,844 | $30,507 | $7,700 | $22,807 |
| 2016 | $5,613 | $30,507 | $7,700 | $22,807 |
| 2015 | $5,113 | $30,507 | $7,700 | $22,807 |
| 2014 | $4,421 | $26,377 | $7,000 | $19,377 |
| 2013 | $4,322 | $26,377 | $7,000 | $19,377 |
Source: Public Records
Map
Nearby Homes
- 1905 N Nordica Ave
- 7234 W North Ave Unit 1214
- 7234 W North Ave Unit 1902
- 7234 W North Ave Unit 1701
- 7234 W North Ave Unit 1602
- 7234 W North Ave Unit 701
- 7234 W North Ave Unit 711
- 7234 W North Ave Unit 1008
- 7234 W North Ave Unit 1610
- 7234 W North Ave Unit 1006
- 1709 N Newland Ave
- 1701 N Newland Ave
- 1625 N 73rd Ct
- 1930 N Harlem Ave Unit 306
- 1930 N Harlem Ave Unit 402
- 1600 N New England Ave Unit 4
- 1143 Woodbine Ave
- 1740 N 74th Ave
- 2016 N Harlem Ave Unit 7W
- 1727 N 74th Ct
- 1751 N Neva Ave
- 1741 N Neva Ave
- 1755 N Neva Ave
- 1737 N Neva Ave
- 1759 N Neva Ave
- 1733 N Neva Ave
- 1729 N Neva Ave
- 1727 N Neva Ave
- 1725 N Neva Ave
- 1744 N Nordica Ave
- 1748 N Nordica Ave
- 1740 N Nordica Ave
- 1801 N Neva Ave
- 1738 N Nordica Ave
- 1721 N Neva Ave
- 1758 N Nordica Ave
- 1758 N Neva Ave
- 1742 N Neva Ave Unit 1N
- 1744 N Neva Ave