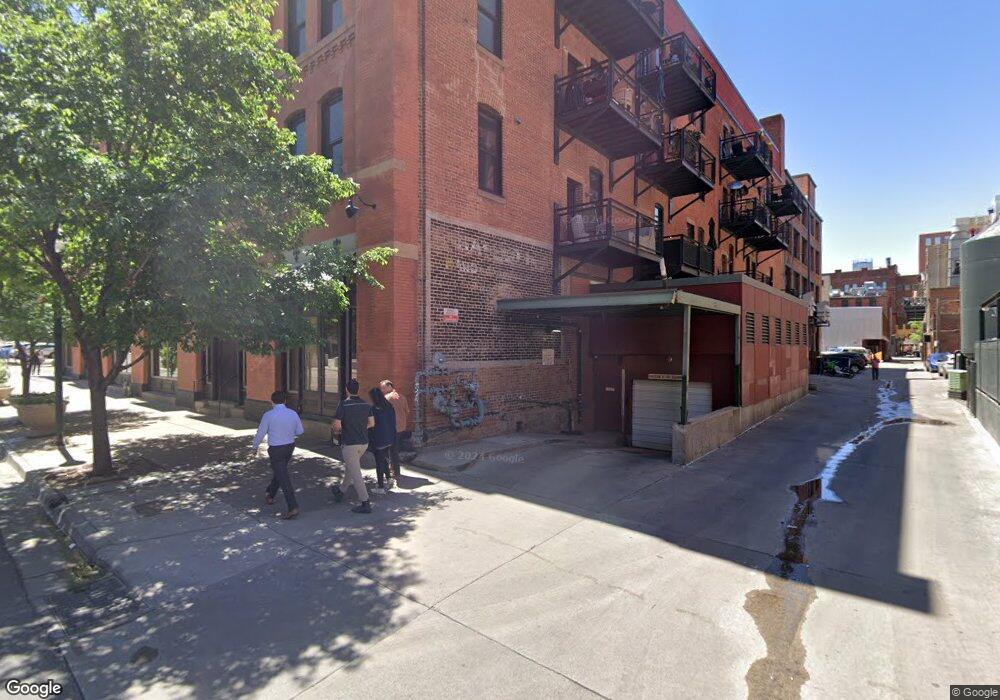
1745 Wazee St Unit 3H Denver, CO 80202
Lower Downtown NeighborhoodEstimated Value: $787,000 - $1,053,000
2
Beds
2
Baths
1,832
Sq Ft
$497/Sq Ft
Est. Value
About This Home
This home is located at 1745 Wazee St Unit 3H, Denver, CO 80202 and is currently estimated at $910,005, approximately $496 per square foot. 1745 Wazee St Unit 3H is a home located in Denver County with nearby schools including Greenlee Elementary School, Kepner Beacon Middle School, and West High School.
Ownership History
Date
Name
Owned For
Owner Type
Purchase Details
Closed on
Nov 7, 2019
Sold by
Smith Geoffrey B
Bought by
Linhardt Martin and Abeyta Linhardt Clarissa
Current Estimated Value
Home Financials for this Owner
Home Financials are based on the most recent Mortgage that was taken out on this home.
Original Mortgage
$620,000
Outstanding Balance
$540,096
Interest Rate
3.12%
Mortgage Type
New Conventional
Estimated Equity
$369,909
Purchase Details
Closed on
Mar 1, 2002
Sold by
Tuttle Mark L
Bought by
Smith Geoffrey B
Home Financials for this Owner
Home Financials are based on the most recent Mortgage that was taken out on this home.
Original Mortgage
$427,500
Interest Rate
7.75%
Purchase Details
Closed on
Jan 28, 2000
Sold by
1745 Wazee Llc
Bought by
Tuttle Mark L
Home Financials for this Owner
Home Financials are based on the most recent Mortgage that was taken out on this home.
Original Mortgage
$373,500
Interest Rate
7.75%
Create a Home Valuation Report for This Property
The Home Valuation Report is an in-depth analysis detailing your home's value as well as a comparison with similar homes in the area
Home Values in the Area
Average Home Value in this Area
Purchase History
| Date | Buyer | Sale Price | Title Company |
|---|---|---|---|
| Linhardt Martin | $775,000 | Land Title Guarantee | |
| Smith Geoffrey B | $475,000 | Land Title Guarantee Company | |
| Tuttle Mark L | $415,000 | -- |
Source: Public Records
Mortgage History
| Date | Status | Borrower | Loan Amount |
|---|---|---|---|
| Open | Linhardt Martin | $620,000 | |
| Previous Owner | Smith Geoffrey B | $427,500 | |
| Previous Owner | Tuttle Mark L | $373,500 |
Source: Public Records
Tax History Compared to Growth
Tax History
| Year | Tax Paid | Tax Assessment Tax Assessment Total Assessment is a certain percentage of the fair market value that is determined by local assessors to be the total taxable value of land and additions on the property. | Land | Improvement |
|---|---|---|---|---|
| 2024 | $4,769 | $60,210 | $6,640 | $53,570 |
| 2023 | $4,665 | $60,210 | $6,640 | $53,570 |
| 2022 | $4,262 | $53,590 | $10,710 | $42,880 |
| 2021 | $4,262 | $55,140 | $11,020 | $44,120 |
| 2020 | $4,071 | $54,870 | $10,170 | $44,700 |
| 2019 | $3,957 | $54,870 | $10,170 | $44,700 |
| 2018 | $4,117 | $53,220 | $6,830 | $46,390 |
| 2017 | $4,105 | $53,220 | $6,830 | $46,390 |
| 2016 | $4,016 | $49,250 | $6,416 | $42,834 |
| 2015 | $3,848 | $49,250 | $6,416 | $42,834 |
| 2014 | $4,340 | $52,250 | $7,697 | $44,553 |
Source: Public Records
Map
Nearby Homes
- 1745 Wazee St Unit 5E
- 1745 Wazee St Unit 2E
- 1745 Wazee St Unit 4H
- 1792 Wynkoop St Unit 307
- 1792 Wynkoop St Unit 508
- 1732 Wazee St Unit R201
- 1720 Wazee St Unit 5B
- 1801 Wynkoop St Unit 515
- 1801 Wynkoop St Unit 603
- 1801 Wynkoop St Unit 409
- 1801 Wynkoop St Unit 217
- 1801 Wynkoop St Unit 203
- 1890 Wynkoop St Unit 805
- 1863 Wazee St Unit 3E
- 1863 Wazee St Unit 4E
- 1863 Wazee St Unit 4B
- 1901 Wazee St Unit 304
- 1901 Wazee St Unit 620
- 1901 Wazee St Unit 407
- 1901 Wazee St Unit 311
- 1745 Wazee St
- 1745 Wazee St Unit 5H
- 1745 Wazee St Unit 5G
- 1745 Wazee St Unit 5F
- 1745 Wazee St Unit 5D
- 1745 Wazee St Unit 5C
- 1745 Wazee St
- 1745 Wazee St
- 1745 Wazee St Unit 4F
- 1745 Wazee St Unit 4E
- 1745 Wazee St
- 1745 Wazee St Unit 4C
- 1745 Wazee St Unit 4B
- 1745 Wazee St
- 1745 Wazee St
- 1745 Wazee St Unit 3F
- 1745 Wazee St
- 1745 Wazee St Unit 3D
- 1745 Wazee St
- 1745 Wazee St Unit 3B