Estimated Value: $1,564,000 - $1,730,000
5
Beds
3
Baths
2,550
Sq Ft
$651/Sq Ft
Est. Value
About This Home
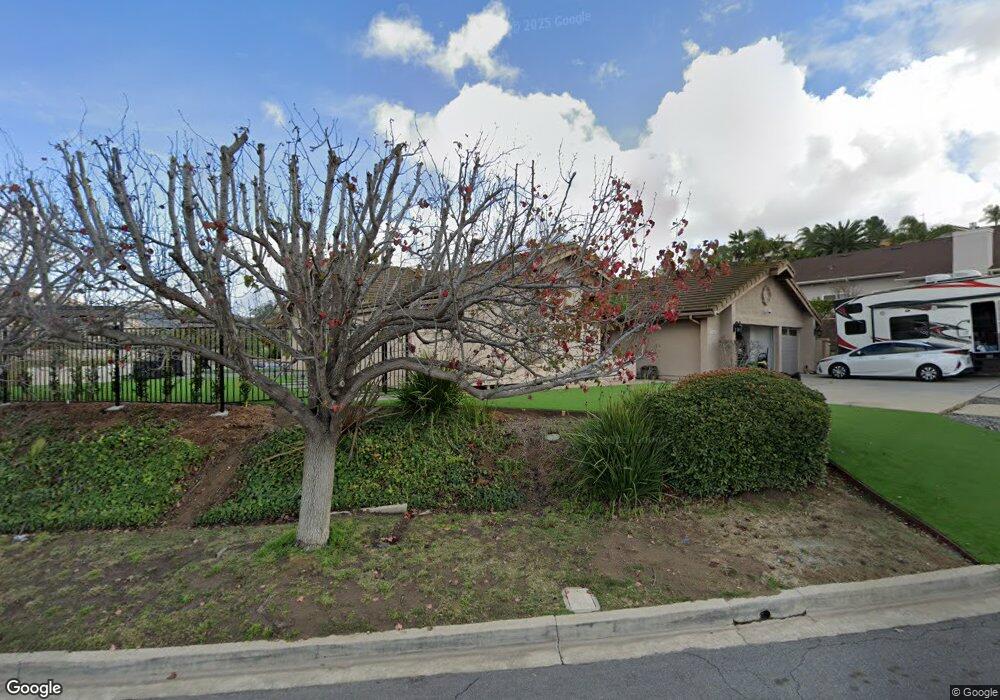
This home is located at 17459 Tam o Shanter Dr, Poway, CA 92064 and is currently estimated at $1,660,343, approximately $651 per square foot. 17459 Tam o Shanter Dr is a home located in San Diego County with nearby schools including Chaparral Elementary, Twin Peaks Middle, and Poway High.
Ownership History
Date
Name
Owned For
Owner Type
Purchase Details
Closed on
Jun 18, 2021
Sold by
Legrand Houshawn and Legrand Amanda N
Bought by
Legrand Houshawn D and Legrand Amanda N
Current Estimated Value
Purchase Details
Closed on
Jun 17, 2016
Sold by
Calhoun Larry L and Calhoun Deborah A
Bought by
Legrand Houshawn and Legrand Amanda N
Home Financials for this Owner
Home Financials are based on the most recent Mortgage that was taken out on this home.
Original Mortgage
$685,200
Outstanding Balance
$546,584
Interest Rate
3.64%
Mortgage Type
New Conventional
Estimated Equity
$1,113,759
Purchase Details
Closed on
May 27, 2005
Sold by
Calhoun Larry L and Calhoun Deborah A
Bought by
Calhoun Larry L and Calhoun Deborah A
Purchase Details
Closed on
Mar 28, 1994
Sold by
Jeter Margaret Elaine
Bought by
Calhoun Larry and Calhoun Deborah
Home Financials for this Owner
Home Financials are based on the most recent Mortgage that was taken out on this home.
Original Mortgage
$260,000
Interest Rate
5%
Create a Home Valuation Report for This Property
The Home Valuation Report is an in-depth analysis detailing your home's value as well as a comparison with similar homes in the area
Home Values in the Area
Average Home Value in this Area
Purchase History
| Date | Buyer | Sale Price | Title Company |
|---|---|---|---|
| Legrand Houshawn D | -- | None Available | |
| Legrand Houshawn | $856,500 | Fidelity National Title Co | |
| Calhoun Larry L | -- | -- | |
| Calhoun Larry L | -- | -- | |
| Calhoun Larry | $300,000 | Union Land Title Company |
Source: Public Records
Mortgage History
| Date | Status | Borrower | Loan Amount |
|---|---|---|---|
| Open | Legrand Houshawn | $685,200 | |
| Previous Owner | Calhoun Larry | $260,000 |
Source: Public Records
Tax History Compared to Growth
Tax History
| Year | Tax Paid | Tax Assessment Tax Assessment Total Assessment is a certain percentage of the fair market value that is determined by local assessors to be the total taxable value of land and additions on the property. | Land | Improvement |
|---|---|---|---|---|
| 2025 | $10,943 | $994,035 | $416,280 | $577,755 |
| 2024 | $10,943 | $974,545 | $408,118 | $566,427 |
| 2023 | $10,711 | $955,437 | $400,116 | $555,321 |
| 2022 | $10,532 | $936,704 | $392,271 | $544,433 |
| 2021 | $10,394 | $918,338 | $384,580 | $533,758 |
| 2020 | $10,254 | $908,922 | $380,637 | $528,285 |
| 2019 | $9,987 | $891,101 | $373,174 | $517,927 |
| 2018 | $9,705 | $873,629 | $365,857 | $507,772 |
| 2017 | $170 | $856,500 | $358,684 | $497,816 |
| 2016 | $4,757 | $430,857 | $180,434 | $250,423 |
| 2015 | $4,686 | $424,386 | $177,724 | $246,662 |
| 2014 | $4,576 | $416,074 | $174,243 | $241,831 |
Source: Public Records
Map
Nearby Homes
- 13611 Penina St
- 17706 Villamoura Dr
- 17727 Valle de Lobo Dr
- 17342 Tam o Shanter Dr
- 13650 Overland Pass
- 13625 Antelope Station
- 17839 Valle de Lobo Dr
- 17759 Saint Andrews Dr
- 17351 Saint Andrews Dr
- 17930 Villamoura Dr
- 17868 Saint Andrews Dr
- 17582 Boca Raton Ln
- 13837 Tam o Shanter Ct
- 17601 Valle Verde Rd
- 17505 Corte Lomas Verdes
- 17924 Saint Andrews Dr
- 17502 Corte Lomas Verdes
- 17233 Cuvee Ct
- 17058 Cloudcroft Dr
- 13665 White Rock Station Rd
- 17441 Tam o Shanter Dr
- 13610 Whitewood Canyon
- 17462 Tam o Shanter Dr
- 17454 Tam o Shanter Dr
- 17468 Tam o Shanter Dr
- 17431 Tam o Shanter Dr
- 17444 Tam o Shanter Dr
- 17504 Tam o Shanter Dr
- 17436 Tam o Shanter Dr
- 17514 Tam o Shanter Dr
- 17421 Tam o Shanter Dr
- 17428 Tam o Shanter Dr
- 13620 Whitewood Canyon
- 17524 Tam o Shanter Dr
- 17441 Abbey Rd
- 17431 Abbey Rd
- 17421 Abbey Rd
- 17411 Tam o Shanter Dr
- 17418 Tam o Shanter Dr
- 17532 Tam o Shanter Dr