1746 Cumberland Rd Unit 8B Aurora, IL 60504
South East Village NeighborhoodEstimated Value: $303,000 - $385,000
3
Beds
3
Baths
1,626
Sq Ft
$215/Sq Ft
Est. Value
About This Home
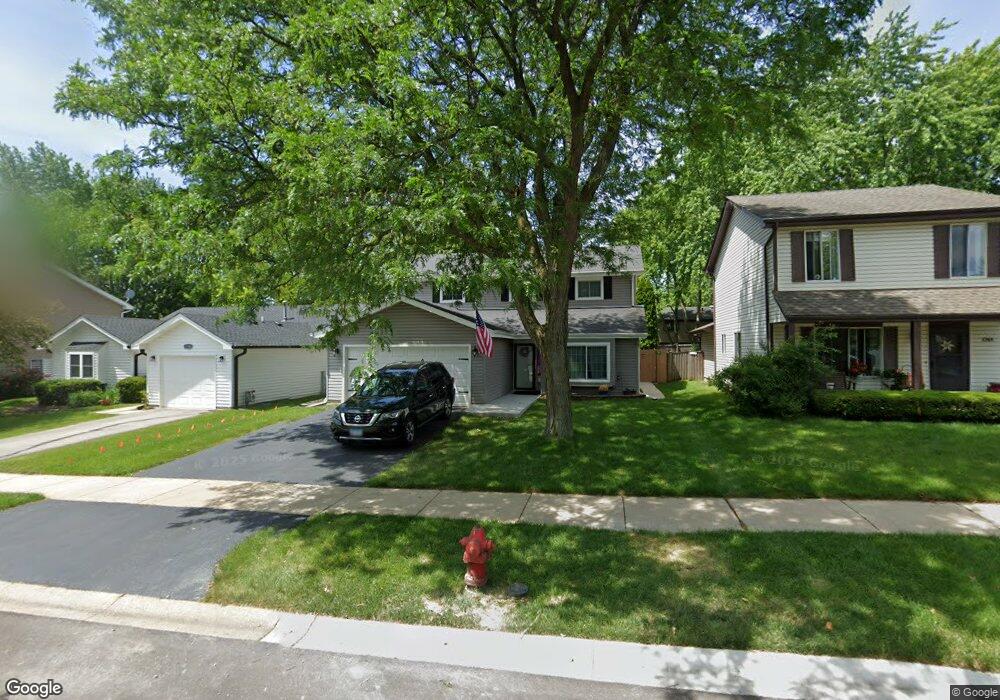
This home is located at 1746 Cumberland Rd Unit 8B, Aurora, IL 60504 and is currently estimated at $350,149, approximately $215 per square foot. 1746 Cumberland Rd Unit 8B is a home located in DuPage County with nearby schools including Gombert Elementary School, Fischer Middle School, and Waubonsie Valley High School.
Ownership History
Date
Name
Owned For
Owner Type
Purchase Details
Closed on
Dec 17, 1998
Sold by
Cortinez Robert O and Cortinez Robert
Bought by
Romero Frank and Garcia Graciela
Current Estimated Value
Home Financials for this Owner
Home Financials are based on the most recent Mortgage that was taken out on this home.
Original Mortgage
$121,050
Outstanding Balance
$27,449
Interest Rate
6.76%
Estimated Equity
$322,700
Purchase Details
Closed on
Nov 29, 1996
Sold by
Alsip Gary L and Alsip Lora F
Bought by
Cortinez Robert and Morrow Carole Lee
Purchase Details
Closed on
Mar 14, 1994
Sold by
Grillo Samuel and Grillo Katherine J
Bought by
Alsip Gary L and Alsip Lora F
Home Financials for this Owner
Home Financials are based on the most recent Mortgage that was taken out on this home.
Original Mortgage
$111,500
Interest Rate
4.25%
Create a Home Valuation Report for This Property
The Home Valuation Report is an in-depth analysis detailing your home's value as well as a comparison with similar homes in the area
Home Values in the Area
Average Home Value in this Area
Purchase History
| Date | Buyer | Sale Price | Title Company |
|---|---|---|---|
| Romero Frank | $134,500 | First American Title | |
| Cortinez Robert | $123,000 | Law Title Pick Up | |
| Alsip Gary L | $124,000 | First American Title Insuran |
Source: Public Records
Mortgage History
| Date | Status | Borrower | Loan Amount |
|---|---|---|---|
| Open | Romero Frank | $121,050 | |
| Previous Owner | Alsip Gary L | $111,500 |
Source: Public Records
Tax History
| Year | Tax Paid | Tax Assessment Tax Assessment Total Assessment is a certain percentage of the fair market value that is determined by local assessors to be the total taxable value of land and additions on the property. | Land | Improvement |
|---|---|---|---|---|
| 2024 | $6,443 | $92,738 | $25,352 | $67,386 |
| 2023 | $6,122 | $83,330 | $22,780 | $60,550 |
| 2022 | $5,718 | $74,190 | $20,120 | $54,070 |
| 2021 | $5,560 | $71,540 | $19,400 | $52,140 |
| 2020 | $5,628 | $71,540 | $19,400 | $52,140 |
| 2019 | $5,420 | $68,040 | $18,450 | $49,590 |
| 2018 | $4,846 | $60,860 | $16,390 | $44,470 |
| 2017 | $4,756 | $58,790 | $15,830 | $42,960 |
| 2016 | $4,662 | $56,420 | $15,190 | $41,230 |
| 2015 | $4,601 | $53,570 | $14,420 | $39,150 |
| 2014 | $4,615 | $52,320 | $13,960 | $38,360 |
| 2013 | $4,570 | $52,690 | $14,060 | $38,630 |
Source: Public Records
Map
Nearby Homes
- 2490 Ridge Ave
- 2509 Brook Ln
- 1655 Trafalgar Ln
- 2465 Bristol Ct Unit 8B
- 2632 Emma Cir
- 2509 Rosehall Ln
- 2730 Dorothy Dr Unit 1
- 2297 Lakeside Dr Unit 10
- 1335 Lawrence Ct
- 2843 Dorothy Dr
- 1465 Bridgeport Ln Unit 19D
- 2484 Warwick Ct
- 2860 Bridgeport Ln Unit 19D
- 1412 Bar Harbour Rd
- 1835 Wisteria Dr Unit 284
- 1875 Keating Dr
- 1874 Keating Dr
- 1871 Keating Dr
- 1868 Keating Dr
- 1966 Congrove Dr
- 1748 Cumberland Rd Unit 8B
- 1744 Cumberland Rd
- 1742 Cumberland Rd
- 1750 Cumberland Rd Unit 8B
- 1679 Trafalgar Ln Unit 8B
- 1677 Trafalgar Ln Unit 8B
- 1740 Cumberland Rd Unit 8B
- 1681 Trafalgar Ln
- 1749 Cumberland Rd
- 1683 Trafalgar Ln
- 1675 Trafalgar Ln Unit 8B
- 1747 Cumberland Rd
- 1738 Cumberland Rd Unit 8B
- 1751 Cumberland Rd
- 1673 Trafalgar Ln
- 1743 Cumberland Rd Unit 8B
- 1741 Cumberland Rd
- 1736 Cumberland Rd
- 2430 Ridge Ave
- 2420 Ridge Ave
Your Personal Tour Guide
Ask me questions while you tour the home.