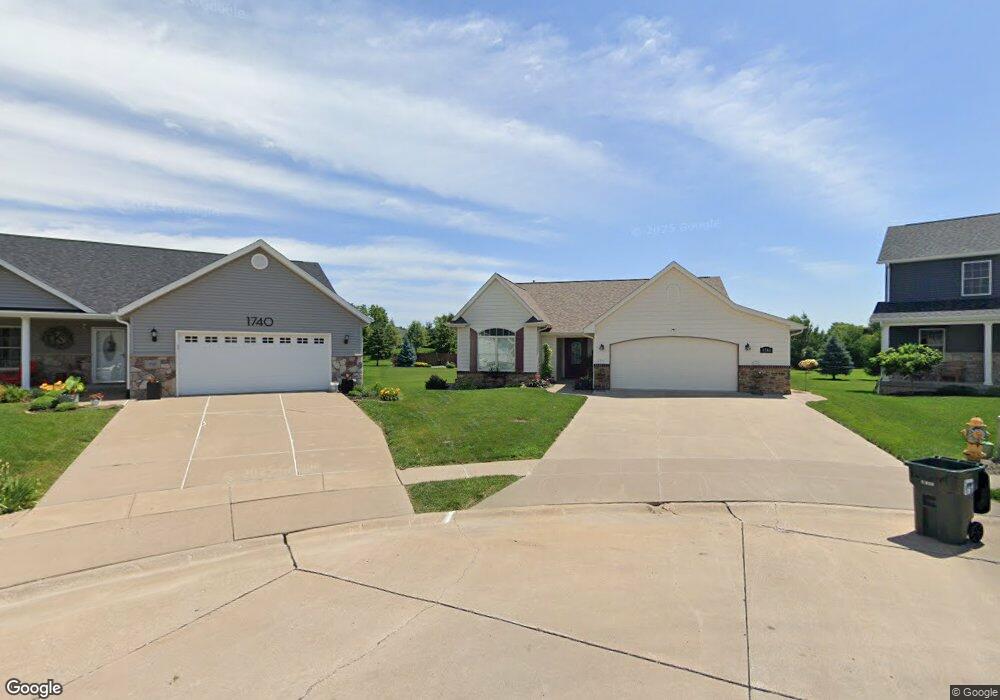
1746 Jordyn Ct Davenport, IA 52807
North Side NeighborhoodEstimated Value: $375,000 - $437,876
3
Beds
3
Baths
1,440
Sq Ft
$289/Sq Ft
Est. Value
About This Home
This home is located at 1746 Jordyn Ct, Davenport, IA 52807 and is currently estimated at $416,469, approximately $289 per square foot. 1746 Jordyn Ct is a home located in Scott County with nearby schools including Eisenhower Elementary School, Sudlow Intermediate School, and Central High School.
Ownership History
Date
Name
Owned For
Owner Type
Purchase Details
Closed on
Jul 11, 2024
Sold by
Williams Jill M and Snider Ronald D
Bought by
Trust Agreement Created By Ronald D Snider An and Snider
Current Estimated Value
Purchase Details
Closed on
Nov 23, 2011
Sold by
Aspen Homes Lc
Bought by
Snider Ronald D and Williams Jull M
Home Financials for this Owner
Home Financials are based on the most recent Mortgage that was taken out on this home.
Original Mortgage
$60,000
Interest Rate
4.12%
Mortgage Type
New Conventional
Purchase Details
Closed on
Jun 24, 2011
Sold by
Nottingate Llc
Bought by
Aspen Homes Lc
Purchase Details
Closed on
Jan 25, 2007
Sold by
Haugen Diane G and Haugen Kenneth
Bought by
Harmony Enterprises Inc
Purchase Details
Closed on
Nov 30, 2006
Sold by
Harmony Enterprises Inc
Bought by
Haugen Diane G and Haugen Kenneth
Create a Home Valuation Report for This Property
The Home Valuation Report is an in-depth analysis detailing your home's value as well as a comparison with similar homes in the area
Home Values in the Area
Average Home Value in this Area
Purchase History
| Date | Buyer | Sale Price | Title Company |
|---|---|---|---|
| Trust Agreement Created By Ronald D Snider An | -- | None Listed On Document | |
| Snider Ronald D | $290,500 | None Available | |
| Aspen Homes Lc | $49,000 | None Available | |
| Harmony Enterprises Inc | -- | None Available | |
| Haugen Diane G | -- | None Available |
Source: Public Records
Mortgage History
| Date | Status | Borrower | Loan Amount |
|---|---|---|---|
| Previous Owner | Snider Ronald D | $60,000 |
Source: Public Records
Tax History Compared to Growth
Tax History
| Year | Tax Paid | Tax Assessment Tax Assessment Total Assessment is a certain percentage of the fair market value that is determined by local assessors to be the total taxable value of land and additions on the property. | Land | Improvement |
|---|---|---|---|---|
| 2024 | $6,440 | $386,750 | $48,660 | $338,090 |
| 2023 | $6,476 | $386,750 | $48,660 | $338,090 |
| 2022 | $6,506 | $312,110 | $42,580 | $269,530 |
| 2021 | $6,506 | $312,110 | $42,580 | $269,530 |
| 2020 | $6,480 | $307,120 | $42,580 | $264,540 |
| 2019 | $6,082 | $279,610 | $42,580 | $237,030 |
| 2018 | $5,950 | $279,610 | $42,580 | $237,030 |
| 2017 | $5,746 | $279,610 | $42,580 | $237,030 |
| 2016 | $5,530 | $261,200 | $0 | $0 |
| 2015 | $5,530 | $254,290 | $0 | $0 |
| 2014 | $5,454 | $249,860 | $0 | $0 |
| 2013 | $5,258 | $0 | $0 | $0 |
| 2012 | -- | $252,850 | $58,010 | $194,840 |
Source: Public Records
Map
Nearby Homes
- 1840 Cromwell Cir
- 6107 Belle Ct
- 6112 Thor Ave
- 6121 Thor Ave
- 6108 Thor Ave
- 6115 Thor Ave
- 6109 Thor Ave
- 2006 E 59th Ct
- 6103 Thor Ave
- 6155 Duggleby Ave
- 6107 Duggleby Ave
- 1811 Katie Ct
- 6319 College Ave
- 6315 College Ave
- 6311 College Ave
- 6307 College Ave
- 6303 College Ave
- 6225 College Ave
- 6221 College Ave
- 6217 College Ave
- 1740 Jordyn Ct
- 1745 Jordyn Ct
- 1732 Jordyn Ct
- 1735 Nicole Ct
- 1741 Jordyn Ct
- 1728 Jordyn Ct
- 1728 Jordyn Ct
- 1733 Jordyn Ct
- 1747 Nicole Ct
- 1731 Nicole Ct
- 1729 Jordyn Ct
- 1724 Jordyn Ct
- 1727 Nicole Ct
- 1725 Jordyn Ct
- 6119 Judson Cir
- 1716 Jordyn Ct
- 1723 Nicole Ct
- 6123 Judson Cir
- 1717 Jordyn Ct
- 1744 Nicole Ct