1746 N Saint Michaels Ct Chicago, IL 60614
Old Town NeighborhoodEstimated Value: $993,928 - $1,096,000
4
Beds
3
Baths
2,179
Sq Ft
$473/Sq Ft
Est. Value
About This Home
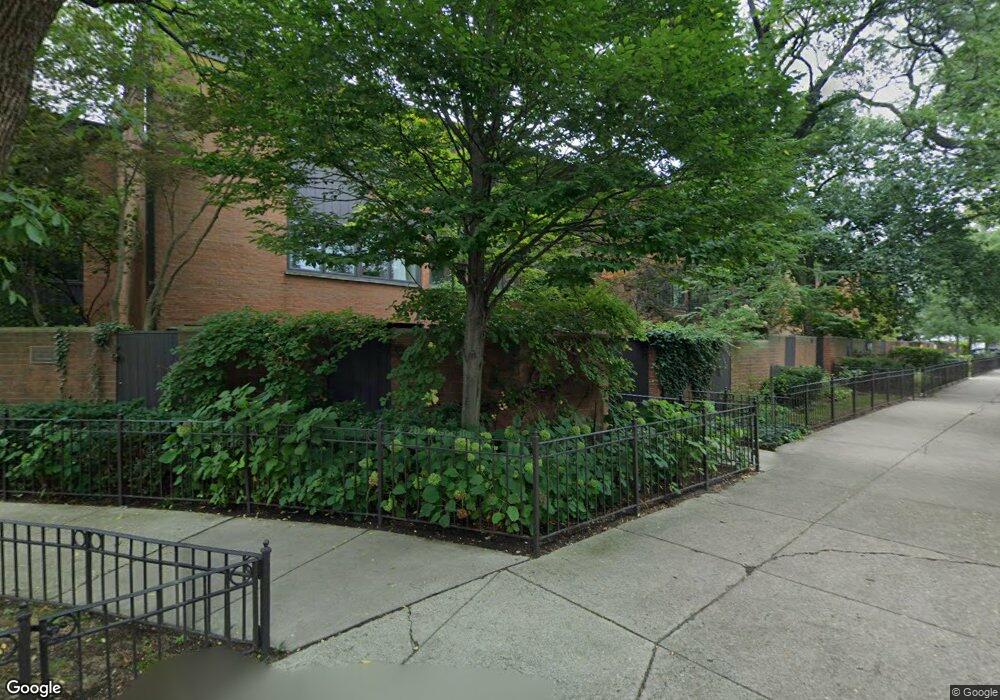
This home is located at 1746 N Saint Michaels Ct, Chicago, IL 60614 and is currently estimated at $1,030,732, approximately $473 per square foot. 1746 N Saint Michaels Ct is a home located in Cook County with nearby schools including Abraham Lincoln Elementary School, Lincoln Park High School, and French-American School of Chicago.
Ownership History
Date
Name
Owned For
Owner Type
Purchase Details
Closed on
Jan 28, 2004
Sold by
Hicks Jonathan Y and Hicks Julie M
Bought by
Anne Feinstein Douglas and Anne Boullerne
Current Estimated Value
Home Financials for this Owner
Home Financials are based on the most recent Mortgage that was taken out on this home.
Original Mortgage
$509,600
Outstanding Balance
$227,160
Interest Rate
5.12%
Mortgage Type
Purchase Money Mortgage
Estimated Equity
$803,572
Purchase Details
Closed on
Jun 14, 2000
Sold by
Garber John T and Whitney Elaine
Bought by
Hicks Jonathan Y and Hicks Julie M
Home Financials for this Owner
Home Financials are based on the most recent Mortgage that was taken out on this home.
Original Mortgage
$364,000
Interest Rate
8.12%
Create a Home Valuation Report for This Property
The Home Valuation Report is an in-depth analysis detailing your home's value as well as a comparison with similar homes in the area
Home Values in the Area
Average Home Value in this Area
Purchase History
| Date | Buyer | Sale Price | Title Company |
|---|---|---|---|
| Anne Feinstein Douglas | $637,000 | Ctic | |
| Hicks Jonathan Y | $489,000 | -- |
Source: Public Records
Mortgage History
| Date | Status | Borrower | Loan Amount |
|---|---|---|---|
| Open | Anne Feinstein Douglas | $509,600 | |
| Previous Owner | Hicks Jonathan Y | $364,000 | |
| Closed | Anne Feinstein Douglas | $95,550 |
Source: Public Records
Tax History Compared to Growth
Tax History
| Year | Tax Paid | Tax Assessment Tax Assessment Total Assessment is a certain percentage of the fair market value that is determined by local assessors to be the total taxable value of land and additions on the property. | Land | Improvement |
|---|---|---|---|---|
| 2024 | $16,180 | $88,242 | $16,647 | $71,595 |
| 2023 | $15,751 | $80,000 | $13,425 | $66,575 |
| 2022 | $15,751 | $80,000 | $13,425 | $66,575 |
| 2021 | $15,418 | $80,000 | $13,425 | $66,575 |
| 2020 | $14,808 | $69,573 | $11,814 | $57,759 |
| 2019 | $14,505 | $75,623 | $11,814 | $63,809 |
| 2018 | $14,259 | $75,623 | $11,814 | $63,809 |
| 2017 | $12,119 | $59,674 | $9,666 | $50,008 |
| 2016 | $11,452 | $59,674 | $9,666 | $50,008 |
| 2015 | $10,454 | $59,674 | $9,666 | $50,008 |
| 2014 | $9,740 | $55,064 | $7,518 | $47,546 |
| 2013 | $9,537 | $55,064 | $7,518 | $47,546 |
Source: Public Records
Map
Nearby Homes
- 505 W Menomonee St
- 1733 N Mohawk St Unit 3N
- 1733 N Larrabee St
- 1715 N Larrabee St Unit 1S
- 1848 N Hudson Ave Unit G
- 1818 N Sedgwick St Unit 12
- 1648 N Cleveland Ave
- 1714 N Sedgwick St
- 1634 N Cleveland Ave
- 1854 N Howe St
- 1626 N Larrabee St
- 658 W Willow St
- 314 W Menomonee St
- 328 W Concord Place
- 545 W Dickens Ave
- 2054 N Mohawk St
- 1942 N Sedgwick St Unit PH
- 437 W North Ave Unit 404
- 1878 N Orchard St
- 450 W Armitage Ave Unit 1
- 1748 N Saint Michaels Ct
- 1744 N Saint Michaels Ct
- 1750 N Saint Michaels Ct
- 1750 N St Michaels Ct Unit 1750
- 1752 N Saint Michaels Ct
- 1754 N Saint Michaels Ct
- 1722 N Saint Michaels Ct
- 1739 N Cleveland Ave
- 1743 N Cleveland Ave
- 1743 N Cleveland Ave Unit 2R
- 1743 N Cleveland Ave Unit 2F
- 1743 N Cleveland Ave Unit 1R
- 1743 N Cleveland Ave Unit 1F
- 1747 N Cleveland Ave
- 1747 N Cleveland Ave Unit 2F
- 1756 N Saint Michaels Ct
- 1751 N Cleveland Ave
- 1751 N Cleveland Ave Unit G
- 1741 N Cleveland Ave
- 1735 N Cleveland Ave