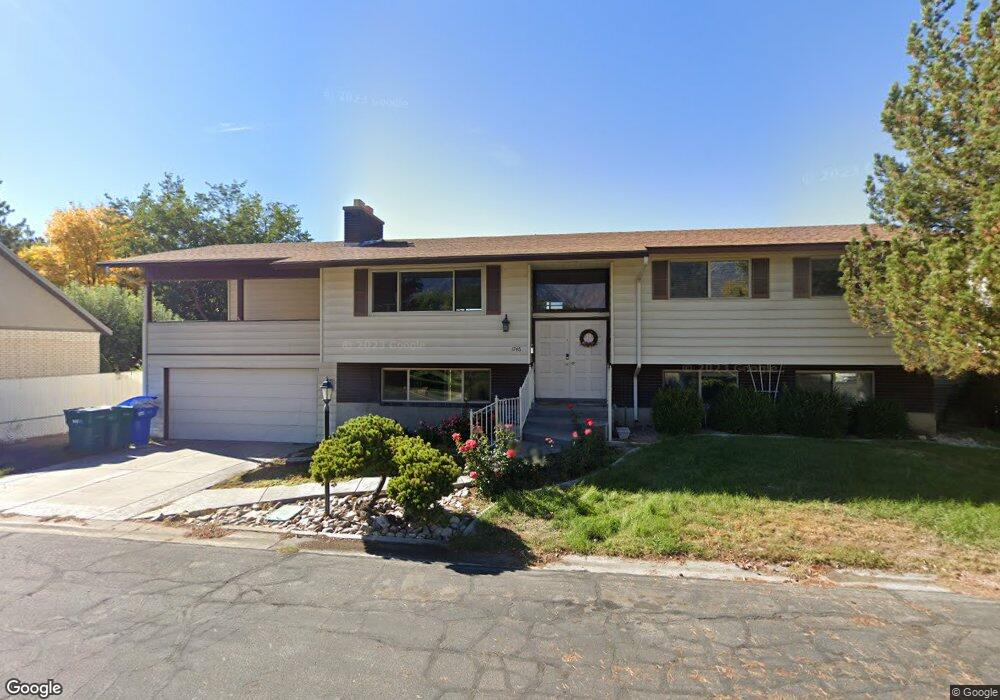
1746 S 290 E Orem, UT 84058
Cherry Hill NeighborhoodEstimated Value: $563,000 - $575,000
5
Beds
3
Baths
2,899
Sq Ft
$196/Sq Ft
Est. Value
About This Home
This home is located at 1746 S 290 E, Orem, UT 84058 and is currently estimated at $567,424, approximately $195 per square foot. 1746 S 290 E is a home located in Utah County with nearby schools including Cherry Hill Elementary School, Lakeridge Jr High School, and Mountain View High School.
Ownership History
Date
Name
Owned For
Owner Type
Purchase Details
Closed on
May 2, 2022
Sold by
Family Trust
Bought by
Muhlestein Joseph W and Muhlestein Wesley K
Current Estimated Value
Home Financials for this Owner
Home Financials are based on the most recent Mortgage that was taken out on this home.
Original Mortgage
$437,600
Outstanding Balance
$415,147
Interest Rate
5.1%
Mortgage Type
Balloon
Estimated Equity
$152,277
Purchase Details
Closed on
Oct 22, 2009
Sold by
Neubert Marylin
Bought by
Neubert Marylin O and Wiggins Nannette Neubert
Create a Home Valuation Report for This Property
The Home Valuation Report is an in-depth analysis detailing your home's value as well as a comparison with similar homes in the area
Home Values in the Area
Average Home Value in this Area
Purchase History
| Date | Buyer | Sale Price | Title Company |
|---|---|---|---|
| Muhlestein Joseph W | -- | Old Republic Title | |
| Neubert Marylin O | -- | None Available |
Source: Public Records
Mortgage History
| Date | Status | Borrower | Loan Amount |
|---|---|---|---|
| Open | Muhlestein Joseph W | $437,600 |
Source: Public Records
Tax History
| Year | Tax Paid | Tax Assessment Tax Assessment Total Assessment is a certain percentage of the fair market value that is determined by local assessors to be the total taxable value of land and additions on the property. | Land | Improvement |
|---|---|---|---|---|
| 2025 | $2,195 | $276,100 | -- | -- |
| 2024 | $2,195 | $268,345 | $0 | $0 |
| 2023 | $2,043 | $268,510 | $0 | $0 |
| 2022 | $2,028 | $258,170 | $0 | $0 |
| 2021 | $1,877 | $362,000 | $126,600 | $235,400 |
| 2020 | $1,630 | $329,800 | $101,300 | $228,500 |
| 2019 | $1,564 | $308,300 | $87,800 | $220,500 |
| 2018 | $1,373 | $279,500 | $84,400 | $195,100 |
| 2017 | $1,365 | $149,215 | $0 | $0 |
| 2016 | $1,354 | $137,445 | $0 | $0 |
| 2015 | $1,348 | $130,075 | $0 | $0 |
| 2014 | $1,292 | $124,630 | $0 | $0 |
Source: Public Records
Map
Nearby Homes
Your Personal Tour Guide
Ask me questions while you tour the home.