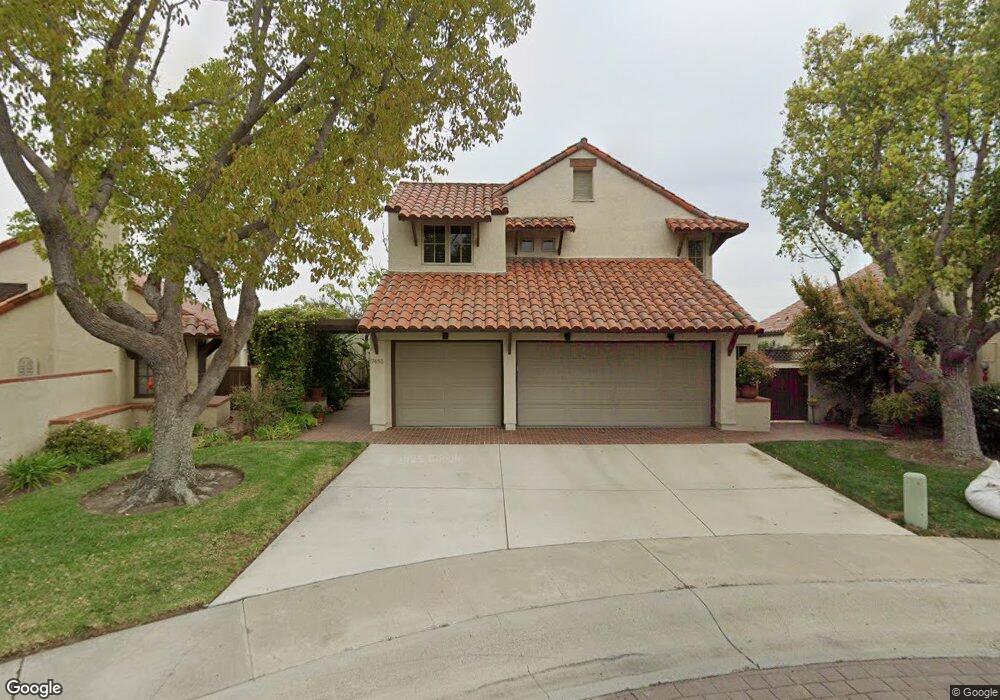
17465 Drayton Hall Way San Diego, CA 92128
Rancho Bernardo NeighborhoodEstimated Value: $1,321,464 - $1,448,000
4
Beds
3
Baths
2,684
Sq Ft
$517/Sq Ft
Est. Value
About This Home
This home is located at 17465 Drayton Hall Way, San Diego, CA 92128 and is currently estimated at $1,388,616, approximately $517 per square foot. 17465 Drayton Hall Way is a home located in San Diego County with nearby schools including Chaparral Elementary, Bernardo Heights Middle, and Rancho Bernardo High.
Ownership History
Date
Name
Owned For
Owner Type
Purchase Details
Closed on
Nov 29, 2010
Sold by
Bradley Jeffrey G and Bradley Jo Ellen
Bought by
Bradley Jeffrey G and Bradley Jo Ellen
Current Estimated Value
Home Financials for this Owner
Home Financials are based on the most recent Mortgage that was taken out on this home.
Original Mortgage
$412,500
Outstanding Balance
$8,854
Interest Rate
3.6%
Mortgage Type
New Conventional
Estimated Equity
$1,379,762
Purchase Details
Closed on
Dec 22, 2003
Sold by
Bradley Jeffrey G and Bradley Jo Ellen
Bought by
Bradley Jeffrey G and Bradley Jo Ellen
Purchase Details
Closed on
Aug 18, 2003
Sold by
Bradley Jeffrey G and Bradley Jo Ellen
Bought by
Bradley Jeffrey G and Bradley Jo Ellen
Home Financials for this Owner
Home Financials are based on the most recent Mortgage that was taken out on this home.
Original Mortgage
$465,500
Interest Rate
5.6%
Mortgage Type
Purchase Money Mortgage
Purchase Details
Closed on
Sep 14, 1984
Create a Home Valuation Report for This Property
The Home Valuation Report is an in-depth analysis detailing your home's value as well as a comparison with similar homes in the area
Home Values in the Area
Average Home Value in this Area
Purchase History
| Date | Buyer | Sale Price | Title Company |
|---|---|---|---|
| Bradley Jeffrey G | -- | Accommodation | |
| Bradley Jeffrey G | -- | Chicago Title Company | |
| Bradley Jeffrey G | -- | -- | |
| Bradley Jeffrey G | -- | -- | |
| Bradley Jeffrey G | -- | Chicago Title Co | |
| -- | $270,000 | -- |
Source: Public Records
Mortgage History
| Date | Status | Borrower | Loan Amount |
|---|---|---|---|
| Open | Bradley Jeffrey G | $412,500 | |
| Closed | Bradley Jeffrey G | $465,500 |
Source: Public Records
Tax History Compared to Growth
Tax History
| Year | Tax Paid | Tax Assessment Tax Assessment Total Assessment is a certain percentage of the fair market value that is determined by local assessors to be the total taxable value of land and additions on the property. | Land | Improvement |
|---|---|---|---|---|
| 2025 | $6,020 | $548,407 | $190,658 | $357,749 |
| 2024 | $6,020 | $537,655 | $186,920 | $350,735 |
| 2023 | $5,891 | $527,113 | $183,255 | $343,858 |
| 2022 | $5,792 | $516,778 | $179,662 | $337,116 |
| 2021 | $5,715 | $506,646 | $176,140 | $330,506 |
| 2020 | $5,637 | $501,452 | $174,334 | $327,118 |
| 2019 | $5,490 | $491,620 | $170,916 | $320,704 |
| 2018 | $5,334 | $481,981 | $167,565 | $314,416 |
| 2017 | $5,191 | $472,531 | $164,280 | $308,251 |
| 2016 | $5,083 | $463,266 | $161,059 | $302,207 |
| 2015 | $5,007 | $456,308 | $158,640 | $297,668 |
| 2014 | $4,888 | $447,371 | $155,533 | $291,838 |
Source: Public Records
Map
Nearby Homes
- 11915 Fairhope Rd
- 11820 Caminito Ronaldo Unit 222
- 11855 Caminito Ronaldo Unit 108
- 17865 Caminito Pinero Unit 251
- 17925 Caminito Pinero Unit 270
- 17885 Caminito Pinero Unit 255
- 17438 Ashburton Rd
- 11864 Bernardo Terrace Unit C
- 11872 Bernardo Terrace Unit E
- 17975 Caminito Pinero Unit 293
- 12022 Versailles Ct
- 12031 Caminito Cadena
- 17071 Bernardo Center Dr Unit A
- 11984 Rancho Bernardo Rd Unit J
- 17147 W Bernardo Dr Unit 103
- 17141 W Bernardo Dr Unit 204
- 17159 W Bernardo Dr Unit 202
- 17081 W Bernardo Dr Unit 203
- 17141 W Bernardo Dr Unit 203
- 17129 W Bernardo Dr Unit 208
- 17459 Drayton Hall Way Unit 15
- 17489 Drayton Hall Way
- 17483 Drayton Hall Way
- 17477 Drayton Hall Way
- 17471 Drayton Hall Way Unit 17
- 17495 Drayton Hall Way
- 17450 Drayton Hall Way Unit 14
- 17456 Drayton Hall Way
- 17481 Fairhope Ct
- 12092 Fairhope Rd
- 12082 Fairhope Rd Unit 29
- 17487 Fairhope Ct
- 12052 Fairhope Rd
- 12122 Fairhope Rd
- 12112 Fairhope Rd
- 12072 Fairhope Rd
- 12032 Fairhope Rd
- 12022 Fairhope Rd
- 12062 Fairhope Rd
- 12132 Fairhope Rd