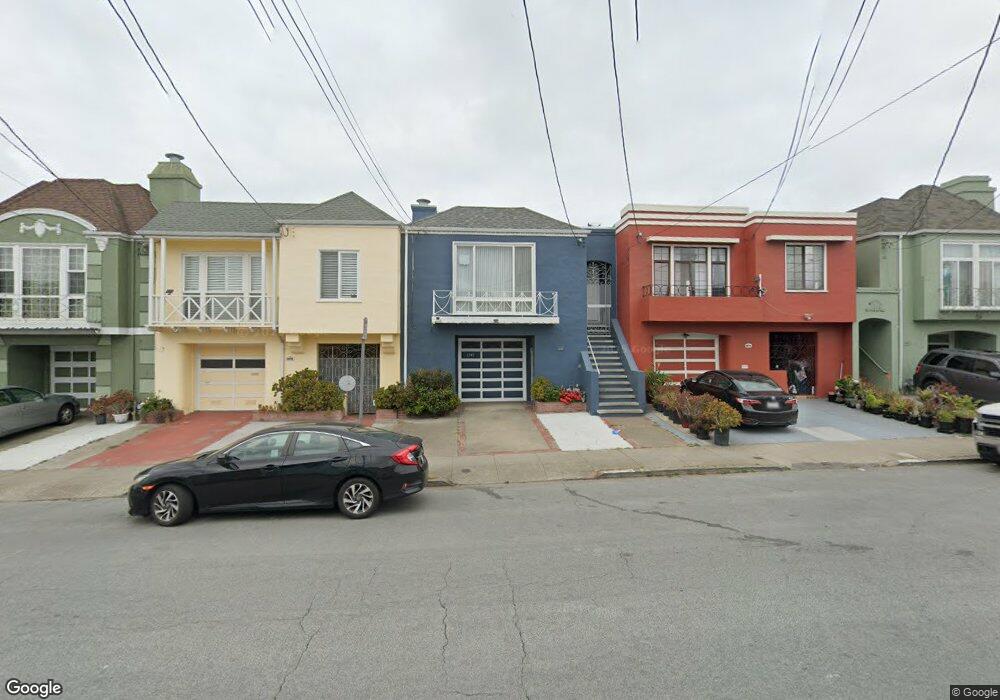
1747 30th Ave San Francisco, CA 94122
Central Sunset NeighborhoodEstimated Value: $1,616,000 - $1,904,000
4
Beds
2
Baths
1,854
Sq Ft
$920/Sq Ft
Est. Value
About This Home
This home is located at 1747 30th Ave, San Francisco, CA 94122 and is currently estimated at $1,705,582, approximately $919 per square foot. 1747 30th Ave is a home located in San Francisco County with nearby schools including Stevenson (Robert Louis) Elementary School, Giannini (A.P.) Middle School, and Cornerstone Academy-Lawton Campus.
Ownership History
Date
Name
Owned For
Owner Type
Purchase Details
Closed on
Sep 27, 2005
Sold by
Lin Martin W and Lin Pansy
Bought by
Lin Martin W and Lin Pansy Y H
Current Estimated Value
Purchase Details
Closed on
Apr 5, 2005
Sold by
Lin Martin W and Lin Pansy
Bought by
Lin Martin W and Lin Pansy
Home Financials for this Owner
Home Financials are based on the most recent Mortgage that was taken out on this home.
Original Mortgage
$100,000
Interest Rate
5.3%
Mortgage Type
New Conventional
Create a Home Valuation Report for This Property
The Home Valuation Report is an in-depth analysis detailing your home's value as well as a comparison with similar homes in the area
Home Values in the Area
Average Home Value in this Area
Purchase History
| Date | Buyer | Sale Price | Title Company |
|---|---|---|---|
| Lin Martin W | -- | -- | |
| Lin Martin W | -- | Fidelity National Title Co |
Source: Public Records
Mortgage History
| Date | Status | Borrower | Loan Amount |
|---|---|---|---|
| Closed | Lin Martin W | $100,000 |
Source: Public Records
Tax History Compared to Growth
Tax History
| Year | Tax Paid | Tax Assessment Tax Assessment Total Assessment is a certain percentage of the fair market value that is determined by local assessors to be the total taxable value of land and additions on the property. | Land | Improvement |
|---|---|---|---|---|
| 2025 | $4,266 | $368,969 | $124,269 | $244,700 |
| 2024 | $4,266 | $361,736 | $121,833 | $239,903 |
| 2023 | $4,205 | $354,645 | $119,445 | $235,200 |
| 2022 | $4,130 | $347,693 | $117,104 | $230,589 |
| 2021 | $4,059 | $340,877 | $114,809 | $226,068 |
| 2020 | $4,071 | $337,384 | $113,633 | $223,751 |
| 2019 | $3,932 | $330,771 | $111,406 | $219,365 |
| 2018 | $3,801 | $324,255 | $109,214 | $215,041 |
| 2017 | $3,756 | $317,899 | $107,074 | $210,825 |
| 2016 | $3,672 | $311,669 | $104,976 | $206,693 |
| 2015 | $3,627 | $306,990 | $103,400 | $203,590 |
| 2014 | $3,531 | $300,978 | $101,375 | $199,603 |
Source: Public Records
Map
Nearby Homes