1747 Snapping Shoals Rd McDonough, GA 30252
Estimated Value: $450,314 - $511,000
4
Beds
3
Baths
2,850
Sq Ft
$168/Sq Ft
Est. Value
About This Home
This home is located at 1747 Snapping Shoals Rd, McDonough, GA 30252 and is currently estimated at $478,829, approximately $168 per square foot. 1747 Snapping Shoals Rd is a home located in Henry County with nearby schools including Rock Spring Elementary School, Ola Middle School, and Ola High School.
Ownership History
Date
Name
Owned For
Owner Type
Purchase Details
Closed on
Jun 30, 2011
Sold by
First Natl Bk Of Griffin
Bought by
Mckee Charlie T and Mckee Christina L
Current Estimated Value
Home Financials for this Owner
Home Financials are based on the most recent Mortgage that was taken out on this home.
Original Mortgage
$208,900
Outstanding Balance
$143,944
Interest Rate
4.62%
Mortgage Type
New Conventional
Estimated Equity
$334,885
Purchase Details
Closed on
Jan 6, 2009
Sold by
Mid-State Wholesale Lumber
Bought by
First National Bank Of Griffin
Purchase Details
Closed on
Jun 29, 2004
Sold by
Brewer Len
Bought by
Carter Lisa C and Carter Marc
Home Financials for this Owner
Home Financials are based on the most recent Mortgage that was taken out on this home.
Original Mortgage
$47,500
Interest Rate
6.25%
Mortgage Type
New Conventional
Create a Home Valuation Report for This Property
The Home Valuation Report is an in-depth analysis detailing your home's value as well as a comparison with similar homes in the area
Home Values in the Area
Average Home Value in this Area
Purchase History
| Date | Buyer | Sale Price | Title Company |
|---|---|---|---|
| Mckee Charlie T | $208,900 | -- | |
| First National Bank Of Griffin | $405,080 | -- | |
| Carter Lisa C | $50,000 | -- |
Source: Public Records
Mortgage History
| Date | Status | Borrower | Loan Amount |
|---|---|---|---|
| Open | Mckee Charlie T | $208,900 | |
| Previous Owner | Carter Lisa C | $47,500 |
Source: Public Records
Tax History Compared to Growth
Tax History
| Year | Tax Paid | Tax Assessment Tax Assessment Total Assessment is a certain percentage of the fair market value that is determined by local assessors to be the total taxable value of land and additions on the property. | Land | Improvement |
|---|---|---|---|---|
| 2025 | $5,553 | $201,600 | $17,240 | $184,360 |
| 2024 | $5,553 | $180,440 | $15,800 | $164,640 |
| 2023 | $4,814 | $181,520 | $15,200 | $166,320 |
| 2022 | $4,331 | $142,680 | $14,040 | $128,640 |
| 2021 | $3,814 | $120,800 | $12,040 | $108,760 |
| 2020 | $3,656 | $114,120 | $11,360 | $102,760 |
| 2019 | $3,509 | $107,880 | $10,760 | $97,120 |
| 2018 | $3,365 | $101,800 | $9,920 | $91,880 |
| 2016 | $3,264 | $97,520 | $8,560 | $88,960 |
| 2015 | $3,313 | $96,200 | $9,720 | $86,480 |
| 2014 | $3,160 | $88,400 | $9,720 | $78,680 |
Source: Public Records
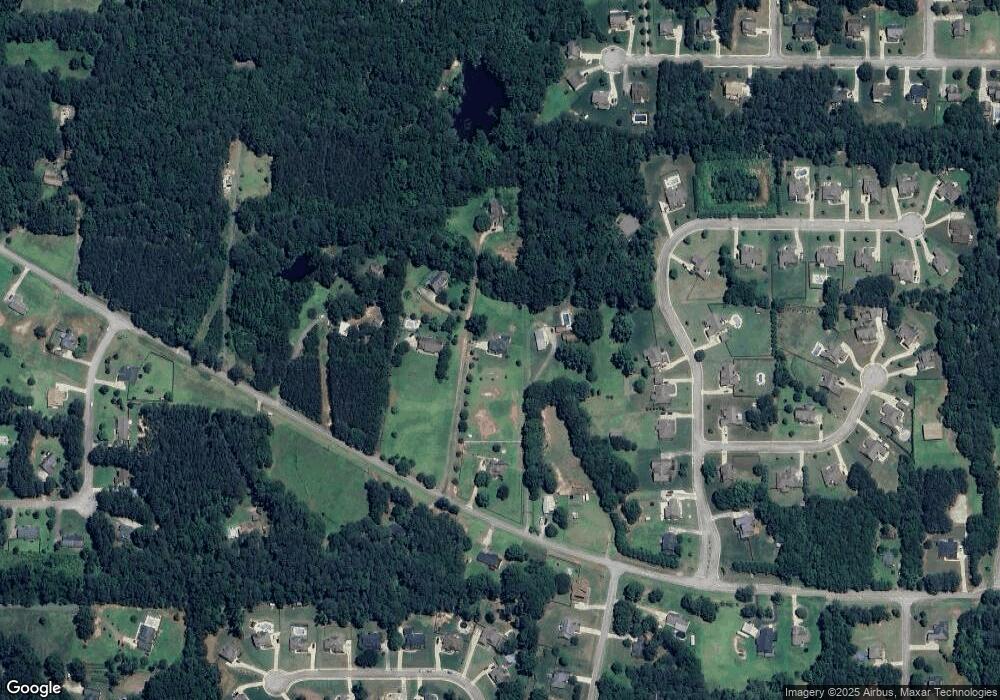
Map
Nearby Homes
- 1739 Snapping Shoals Rd
- 101 Elite Way
- 205 Dupont Ct
- 925 Wynn Rd
- 1045 Matthews Way
- 185 Mount Bethel Rd
- 146 Mount Bethel Rd
- 132 Fisher Mill Dr
- 563 Wynn Rd
- 147 Nobility Ln
- 254 River Rd
- 253 River Rd
- 132 Lynnview Ct
- 108 Nobility Ln
- 843 Honey Creek Rd
- 100 Lavender Way
- 160 Stroud Rd
- 185 Wynn Rd
- 0 Highway 81 St E Unit 10597150
- 4904 Highway 81 E
- 1725 Snapping Shoals Rd
- 1785 Snapping Shoals Rd
- 1731 Snapping Shoals Rd
- 1755 Snapping Shoals Rd
- 117 Elite Way Unit 33
- 121 Elite Way Unit 32
- 125 Elite Way
- 113 Elite Way Unit 34
- 113 Elite Way
- 1703 Snapping Shoals Rd
- 1799 Snapping Shoals Rd
- 109 Elite Way
- 109 Elite Way Unit 35
- 1756 Snapping Shoals Rd
- 1766 Snapping Shoals Rd
- 124 Elite Way Unit 17
- 124 Elite Way
- 120 Elite Way Unit 16
- 129 Elite Way Unit 30
- 105 Elite Way